Fig. 6
Download original image
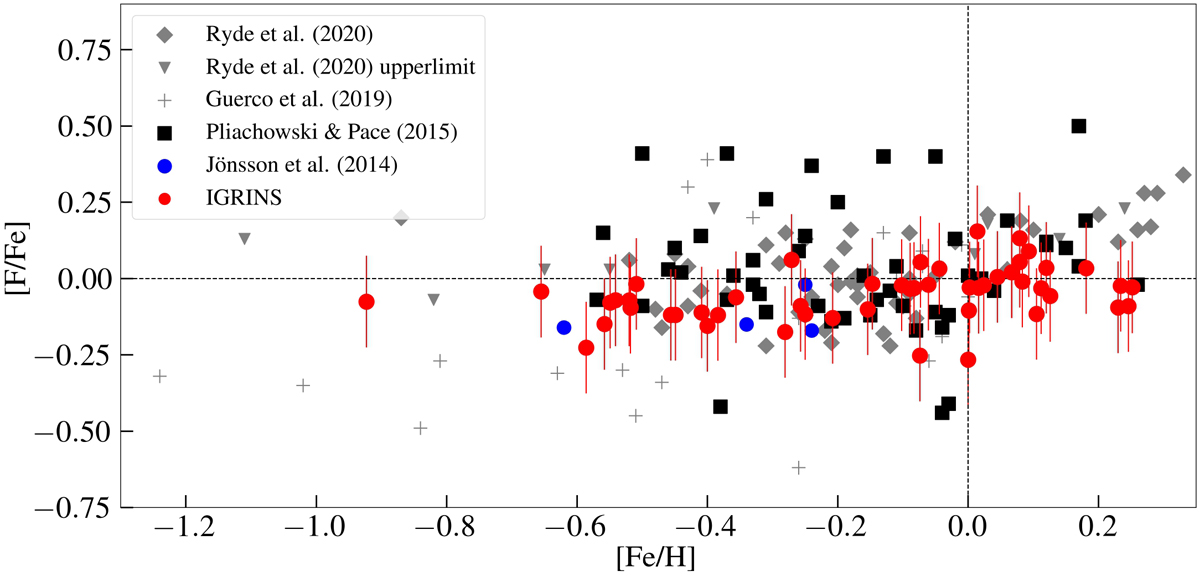
Mean [Fe/Fe] vs. [Fe/H] for M giants in our sample (red circles) after excluding the fluorine abundances from the four reddest and strongest HF lines at 23 040.57 Å (R12), 23 134.76 Å (R11), 23 358 Å (R9), and 23 629.99 Å (R7). The black squares denote the stars in Pilachowski & Pace (2015), the blue circles the stars in Jönsson et al. (2014a), the plus signs the stars in Guerço et al. (2019a), and the gray diamonds and inverted triangles the stars in Ryde et al. (2020).
Current usage metrics show cumulative count of Article Views (full-text article views including HTML views, PDF and ePub downloads, according to the available data) and Abstracts Views on Vision4Press platform.
Data correspond to usage on the plateform after 2015. The current usage metrics is available 48-96 hours after online publication and is updated daily on week days.
Initial download of the metrics may take a while.