Fig. 4
Download original image
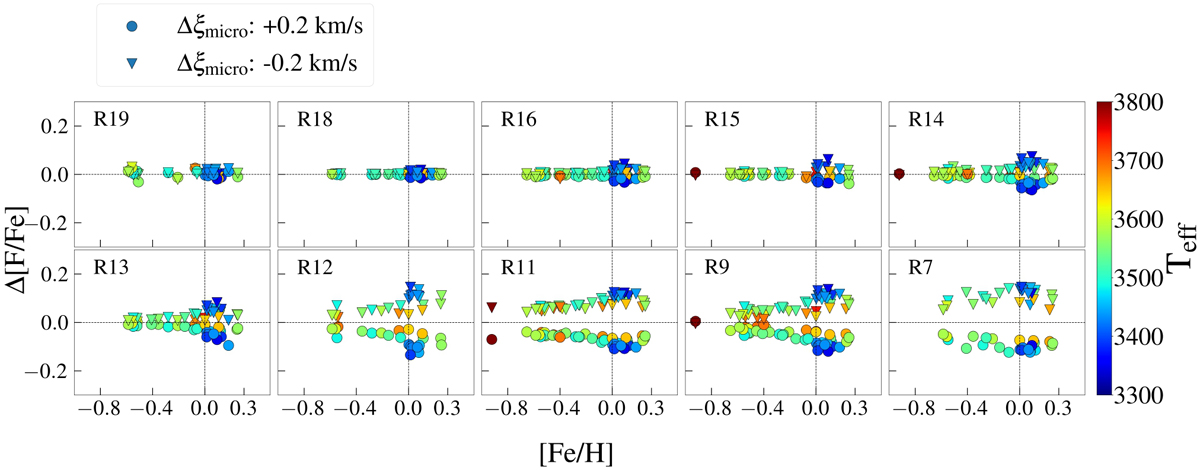
Change in [F/Fe] as a function of variation in ξmicro. The color-coding indicates the Teff (see color bar at right) for the first five HF lines (R19, R18, R16, R15, and R14; top) and the last five HF lines (R13, R12, R11, R9, and R7; bottom). The variation in [F/Fe] for a +0.2 km s−1 change in ξmicro is shown by inverted triangles and for a −0.2 km s−1 change in ξmicro by circles.
Current usage metrics show cumulative count of Article Views (full-text article views including HTML views, PDF and ePub downloads, according to the available data) and Abstracts Views on Vision4Press platform.
Data correspond to usage on the plateform after 2015. The current usage metrics is available 48-96 hours after online publication and is updated daily on week days.
Initial download of the metrics may take a while.