Fig. 2
Download original image
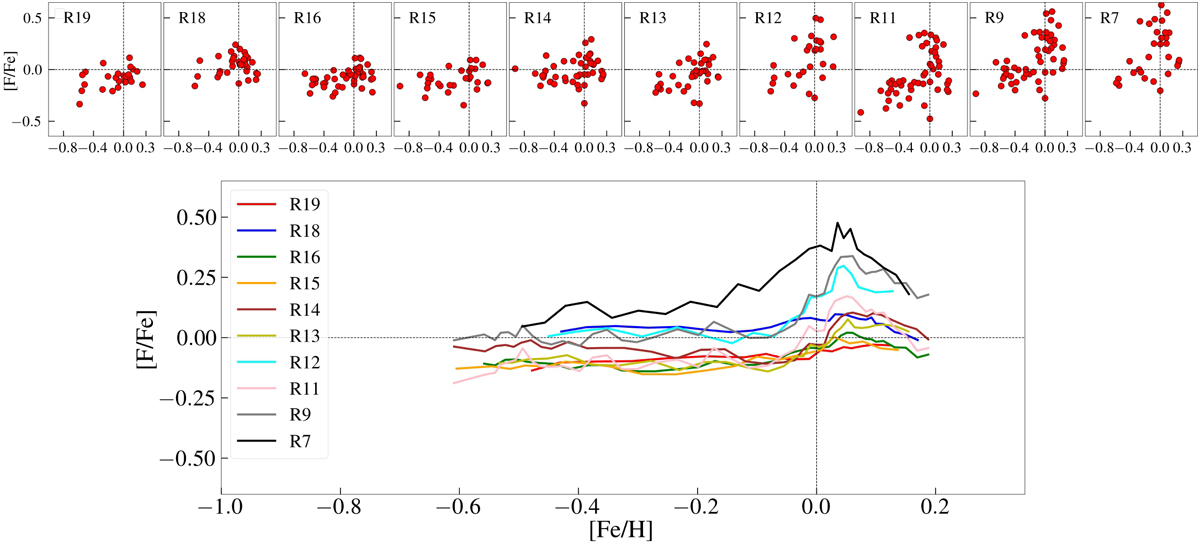
Individual [F/Fe] vs. [Fe/H] trends. Top panels: [F/Fe] vs. [Fe/H] for the 50 solar neighborhood M giants (red circles) determined from the six K-band molecular HF lines (each panel) in the IGRINS spectra. All are scaled to the following solar abundances: A(F)⊙ = 4.43 (Lodders 2003) and A(Fe)⊙ = 7.45 (Grevesse et al. 2007). There is an evident increase and large scatter in [F/Fe] determined from the four reddest and strongest HF lines at 23 040.57 Å (R12), 23 134.76 Å (R11), 23 358 Å (R9), and 23 629.99 Å (R7) for stars with [Fe/H] ~ 0 dex and above (not evident in other lines)
Current usage metrics show cumulative count of Article Views (full-text article views including HTML views, PDF and ePub downloads, according to the available data) and Abstracts Views on Vision4Press platform.
Data correspond to usage on the plateform after 2015. The current usage metrics is available 48-96 hours after online publication and is updated daily on week days.
Initial download of the metrics may take a while.