Fig. 1
Download original image
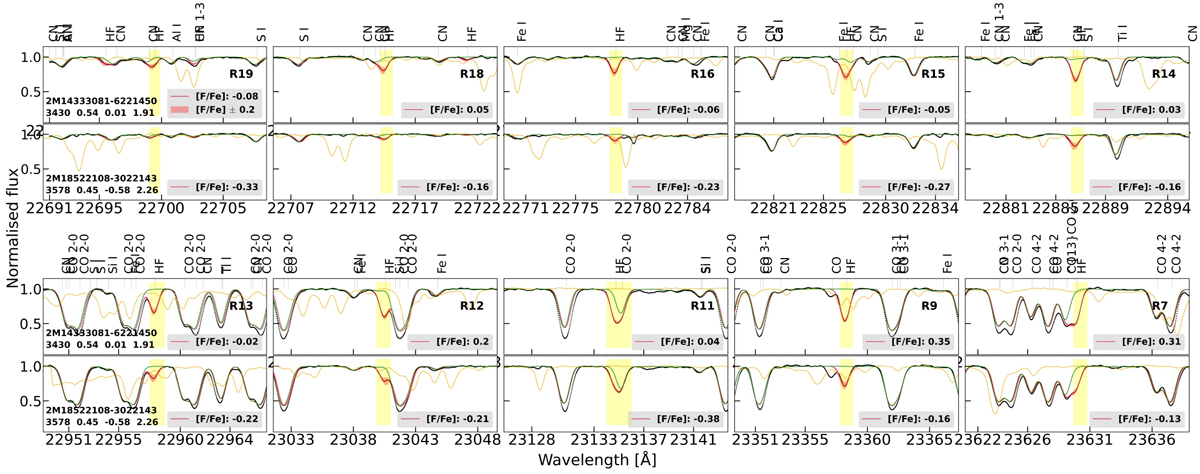
Ten HF lines used to determine fluorine abundances. The top two rows show the observed spectra (black circles) for five HF lines (R19, R18, R16, R15, and R14) of one metal-rich star (32) and one metal-poor star (44); the stellar parameters (Teff, log ɡ, [Fe/H], and ξmicro) are to the left. The bottom two rows show the observed spectra for the remaining five HF lines (R13, R12, R11, R9, and R7) of the same two stars. The orange line denotes where the telluric lines lie before the telluric correction, and the red band the variation in the synthetic spectrum for ± 0.2 dex difference in fluorine abundance. The green line shows the synthetic spectrum without HF. The [F/Fe] values are also listed for each line. All identified atomic and molecular lines are denoted above the spectra.
Current usage metrics show cumulative count of Article Views (full-text article views including HTML views, PDF and ePub downloads, according to the available data) and Abstracts Views on Vision4Press platform.
Data correspond to usage on the plateform after 2015. The current usage metrics is available 48-96 hours after online publication and is updated daily on week days.
Initial download of the metrics may take a while.