Fig. 6
Download original image
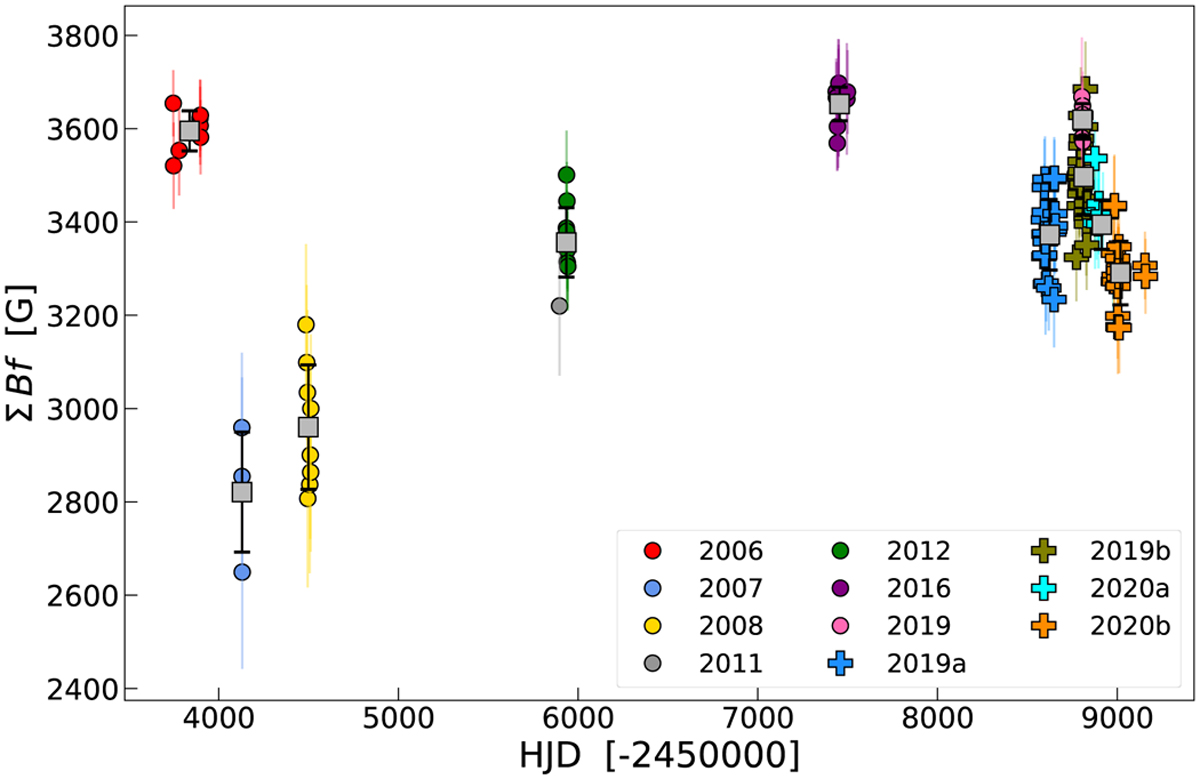
Long-term evolution of the magnetic flux density measured from Zeeman broadening modelling. The data point format is the same as Fig. 2, and for each epoch we overplotted the mean value and standard deviation as error bar. There is an overall trend that reflects the variations of B1 across both optical and near-infrared data. In addition, for the near-infrared SPIRou time series, we also observe the same oscillating behaviour found for the FWHM of Stokes I.
Current usage metrics show cumulative count of Article Views (full-text article views including HTML views, PDF and ePub downloads, according to the available data) and Abstracts Views on Vision4Press platform.
Data correspond to usage on the plateform after 2015. The current usage metrics is available 48-96 hours after online publication and is updated daily on week days.
Initial download of the metrics may take a while.