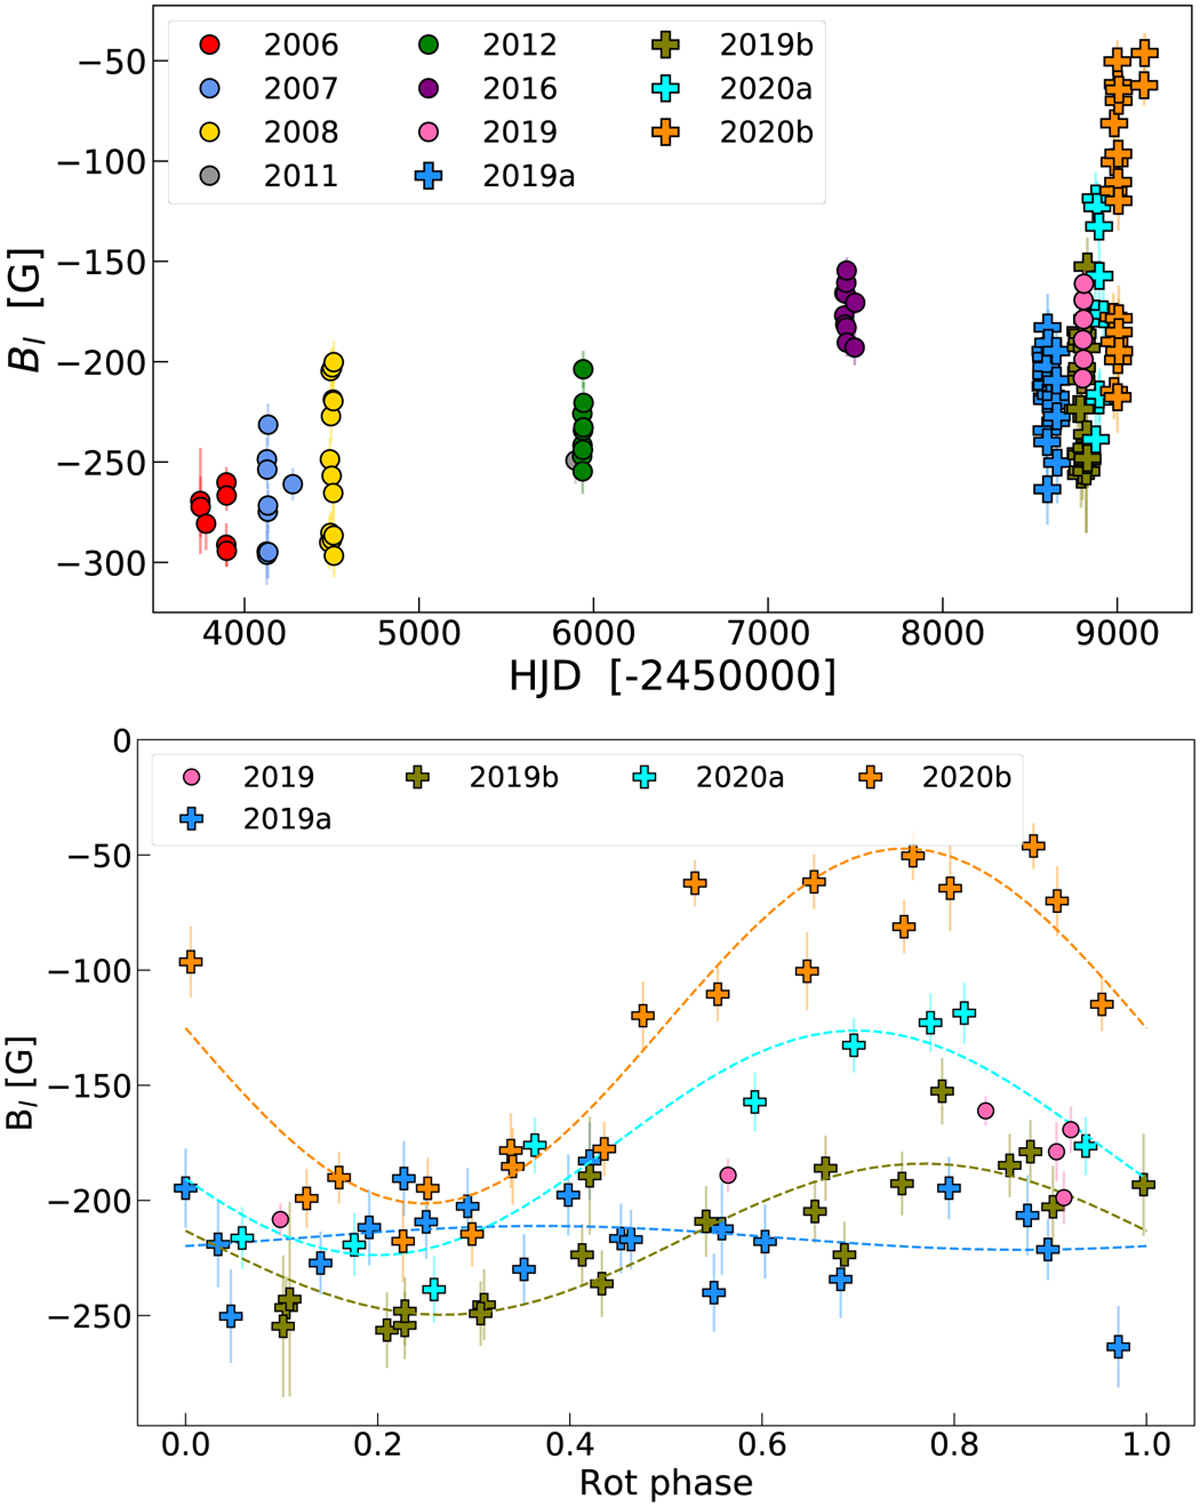
Fig. 2
Download original image
Temporal evolution of the longitudinal magnetic field (Bl). Top: full time series of measurements between 2006 and 2020 with ESPaDOnS, Narval and SPIRou. The shape of the data points corresponds to the wavelength domain, optical (circles) or near-infrared (pluses), and the colour to the epoch in which the observations were performed. Bottom: SPIRou time series split in four epochs phase-folded according to Eq. (1). The least-square sine fit corresponding to Eq. (3) (Stibbs 1950), to assess the change in magnetic obliquity, is shown as dashed lines. The six ESPaDOnS observations taken in 2019 are plotted as pink circles.
Current usage metrics show cumulative count of Article Views (full-text article views including HTML views, PDF and ePub downloads, according to the available data) and Abstracts Views on Vision4Press platform.
Data correspond to usage on the plateform after 2015. The current usage metrics is available 48-96 hours after online publication and is updated daily on week days.
Initial download of the metrics may take a while.