Fig. B.1
Download original image
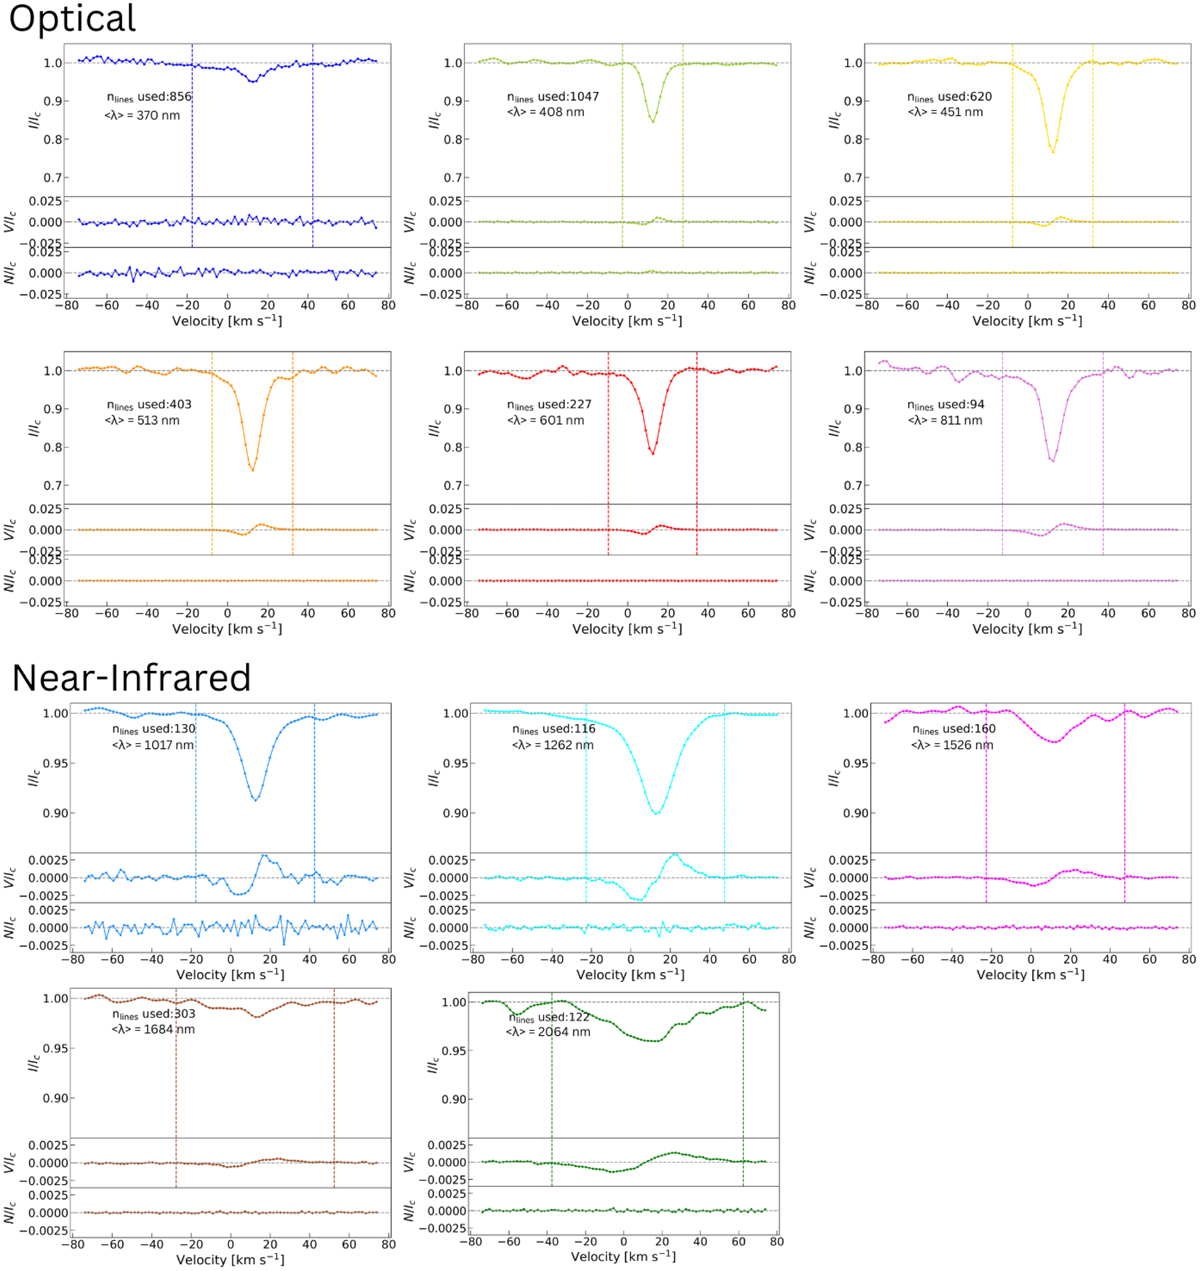
Series of Stokes profiles computed with subsets of the line list used for LSD, as described in Sec.4. Every panel displays Stokes I (top), V (middle) and N (bottom) for each line subset and vertical dashed lines indicate the adjusted velocity range over which Bl was estimated. The optical profiles are obtained by stacking the ESPaDOnS observations from 2019, whereas the near-infrared ones from SPIRou 2019b time series, for each panel. The number of lines used in the LSD computation as well as the mean wavelength are displayed.
Current usage metrics show cumulative count of Article Views (full-text article views including HTML views, PDF and ePub downloads, according to the available data) and Abstracts Views on Vision4Press platform.
Data correspond to usage on the plateform after 2015. The current usage metrics is available 48-96 hours after online publication and is updated daily on week days.
Initial download of the metrics may take a while.