Fig. 13
Download original image
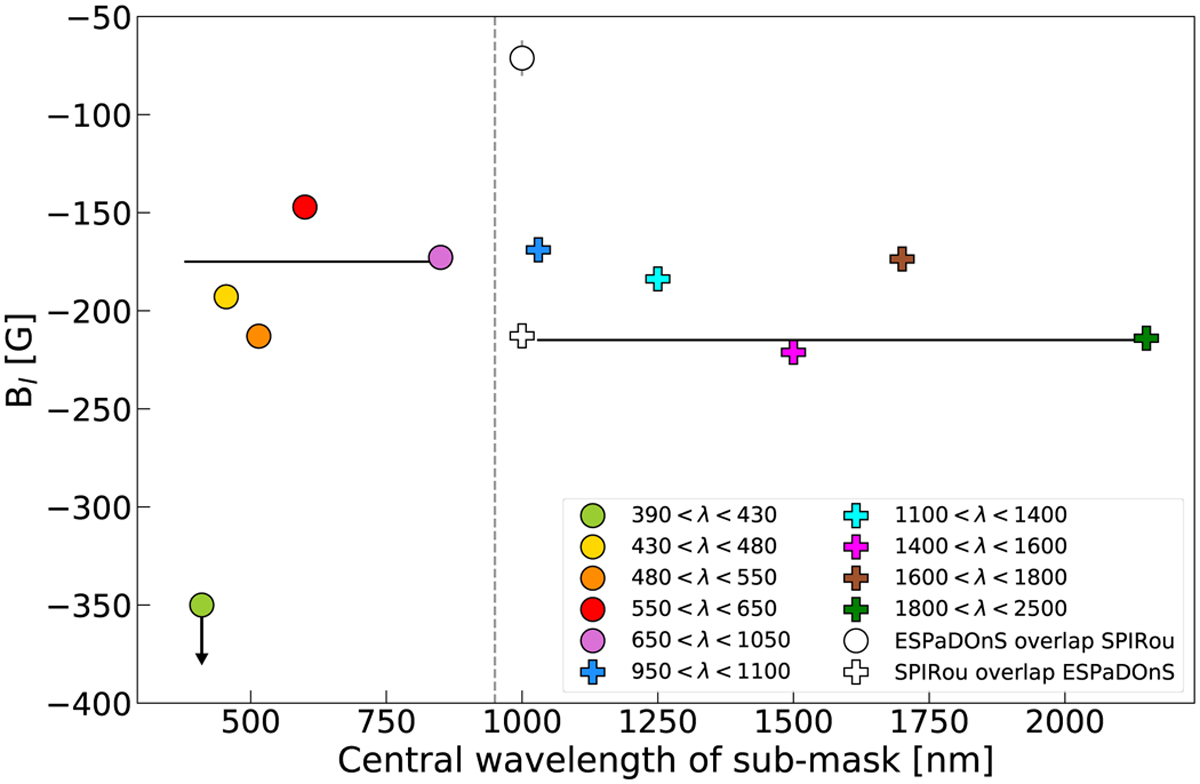
Test on B1 measurements chromaticity. Shown are B1 measurements obtained with line mask subsets based on wavelength of the optical (circles) and near-infrared (pluses) domain. The horizontal black lines indicate the values of B1 computed with the full masks and the vertical dashed line separates arbitrarily optical from near-infrared measurements. The error bars are smaller than the symbol size. For visualisation purposes, the [350, 390] nm wavelength bin is not shown since it leads to an outlier data point at around −1 kG, and the [390, 430] nm bin yields a value at −750 G so it is indicated with a downwards arrow. Overall, no chromatic trend emerges from the data.
Current usage metrics show cumulative count of Article Views (full-text article views including HTML views, PDF and ePub downloads, according to the available data) and Abstracts Views on Vision4Press platform.
Data correspond to usage on the plateform after 2015. The current usage metrics is available 48-96 hours after online publication and is updated daily on week days.
Initial download of the metrics may take a while.