Fig. 2.
Download original image
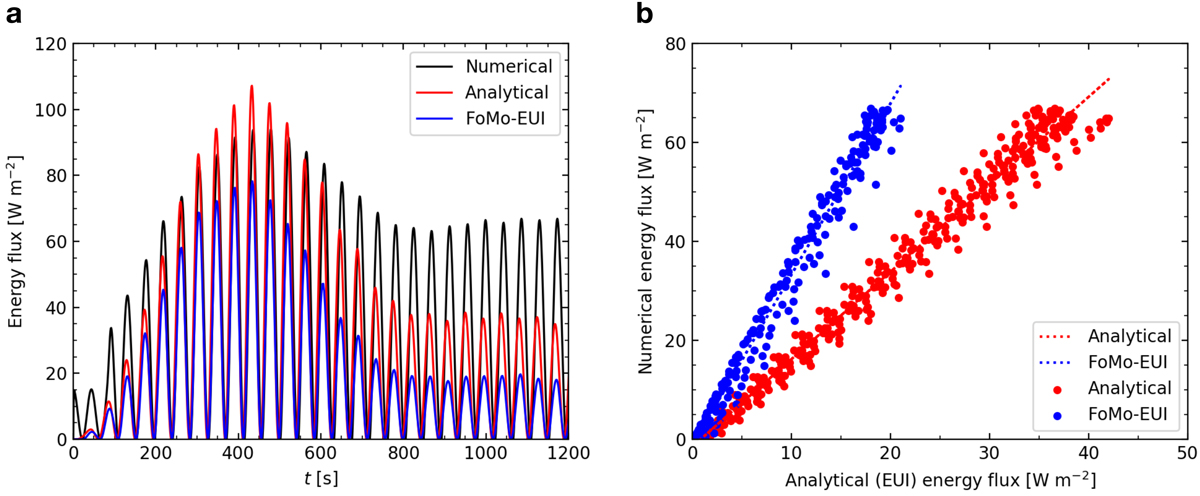
Energy flux changes in the numerical model and forward model. (a) Energy flux obtained from the numerical results given by Eq. (7) (black line), analytical results given by Eq. (1) (red line), and the energy flux calculated using Eq. (1) with the synthetic displacement in Fig. 3b (blue line). (b) Scatter plots of the energy flux when t > tc. The horizontal axis represents the analytical (red) and synthetic EUI (blue) energy flux, while the vertical axis shows the numerical energy flux. Dashed lines illustrate the linear fits of the data, and their slopes correspond to the factors α and αeui.
Current usage metrics show cumulative count of Article Views (full-text article views including HTML views, PDF and ePub downloads, according to the available data) and Abstracts Views on Vision4Press platform.
Data correspond to usage on the plateform after 2015. The current usage metrics is available 48-96 hours after online publication and is updated daily on week days.
Initial download of the metrics may take a while.