Open Access
Fig. 1.
Download original image
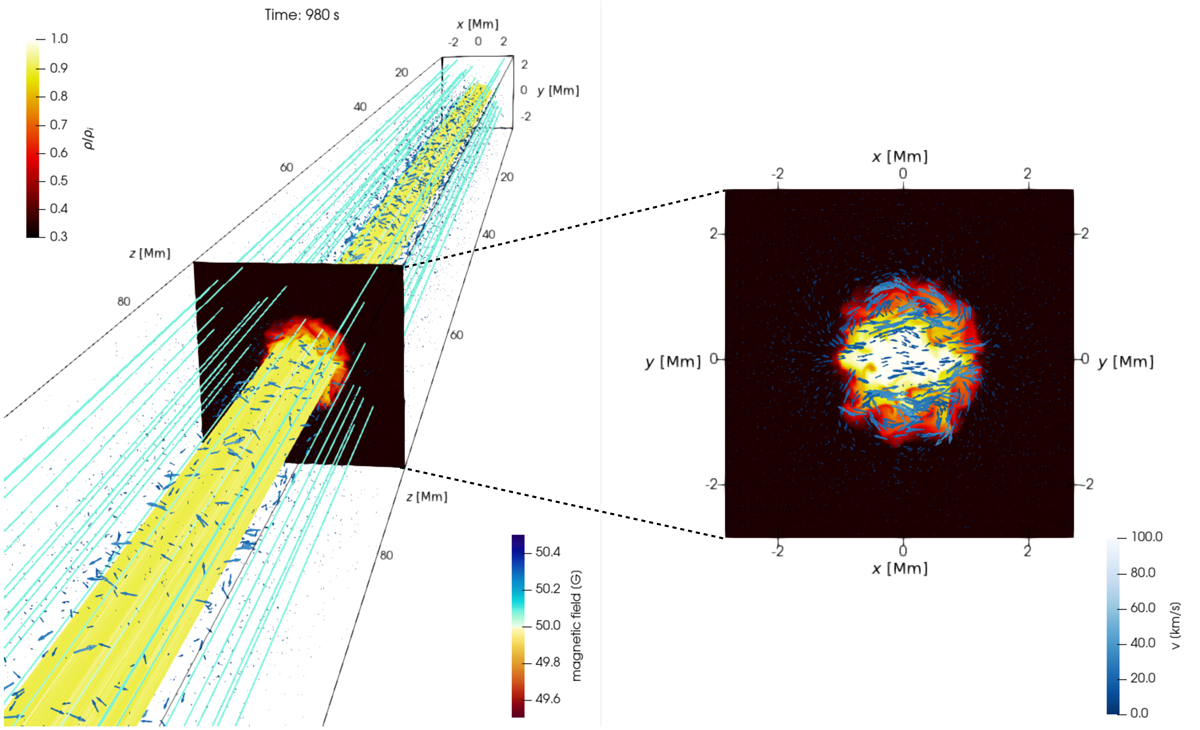
Snapshot of the isosurface of density showing the loop structure at t = 980 s. The velocity field is represented by blue arrows. Magnetic field lines are overplotted in the left panel. The loop apex cross-cut is shown on the right.
Current usage metrics show cumulative count of Article Views (full-text article views including HTML views, PDF and ePub downloads, according to the available data) and Abstracts Views on Vision4Press platform.
Data correspond to usage on the plateform after 2015. The current usage metrics is available 48-96 hours after online publication and is updated daily on week days.
Initial download of the metrics may take a while.