Open Access
Fig. 6.
Download original image
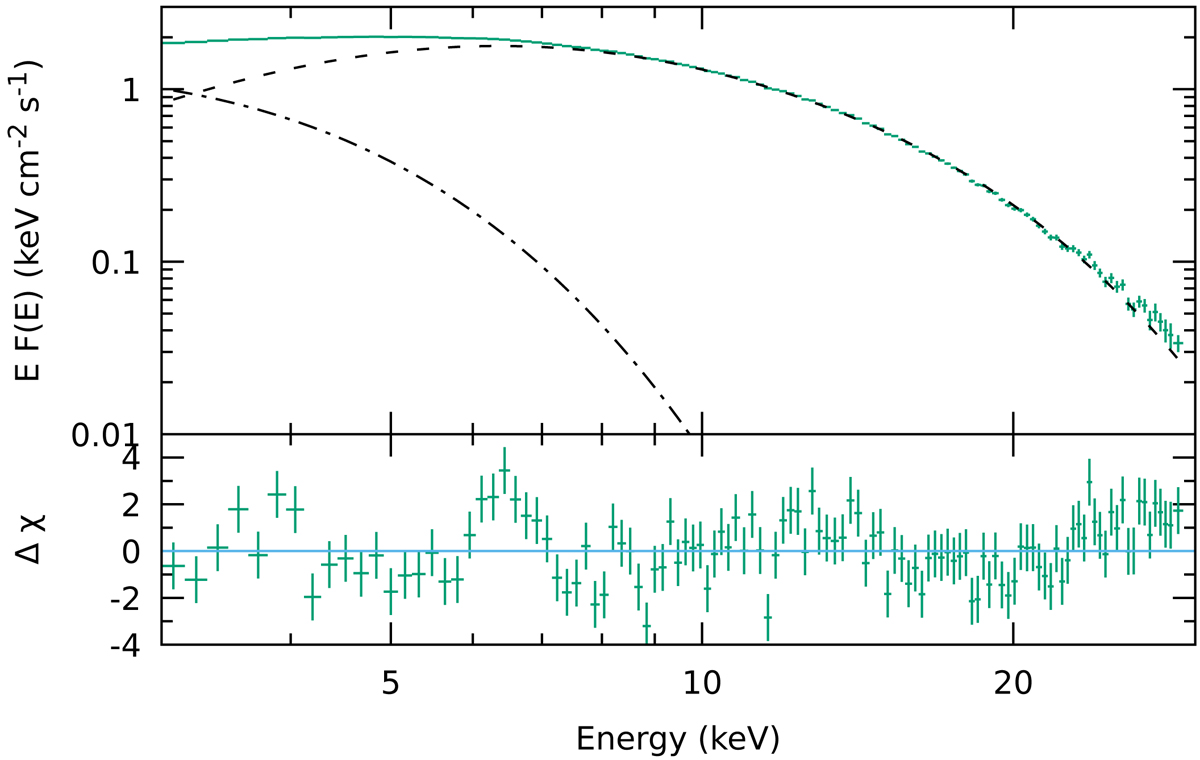
Fit of the NuSTAR spectrum. Top panel: deconvolved NuSTAR spectrum fitted with a model composed of diskbb (dash-dotted line) and comptt (dashed line). Bottom panel: residuals in units of σ. The data from the two detectors FPMA and FPMB were combined (with setplot group in XSPEC) for plotting purposes only.
Current usage metrics show cumulative count of Article Views (full-text article views including HTML views, PDF and ePub downloads, according to the available data) and Abstracts Views on Vision4Press platform.
Data correspond to usage on the plateform after 2015. The current usage metrics is available 48-96 hours after online publication and is updated daily on week days.
Initial download of the metrics may take a while.