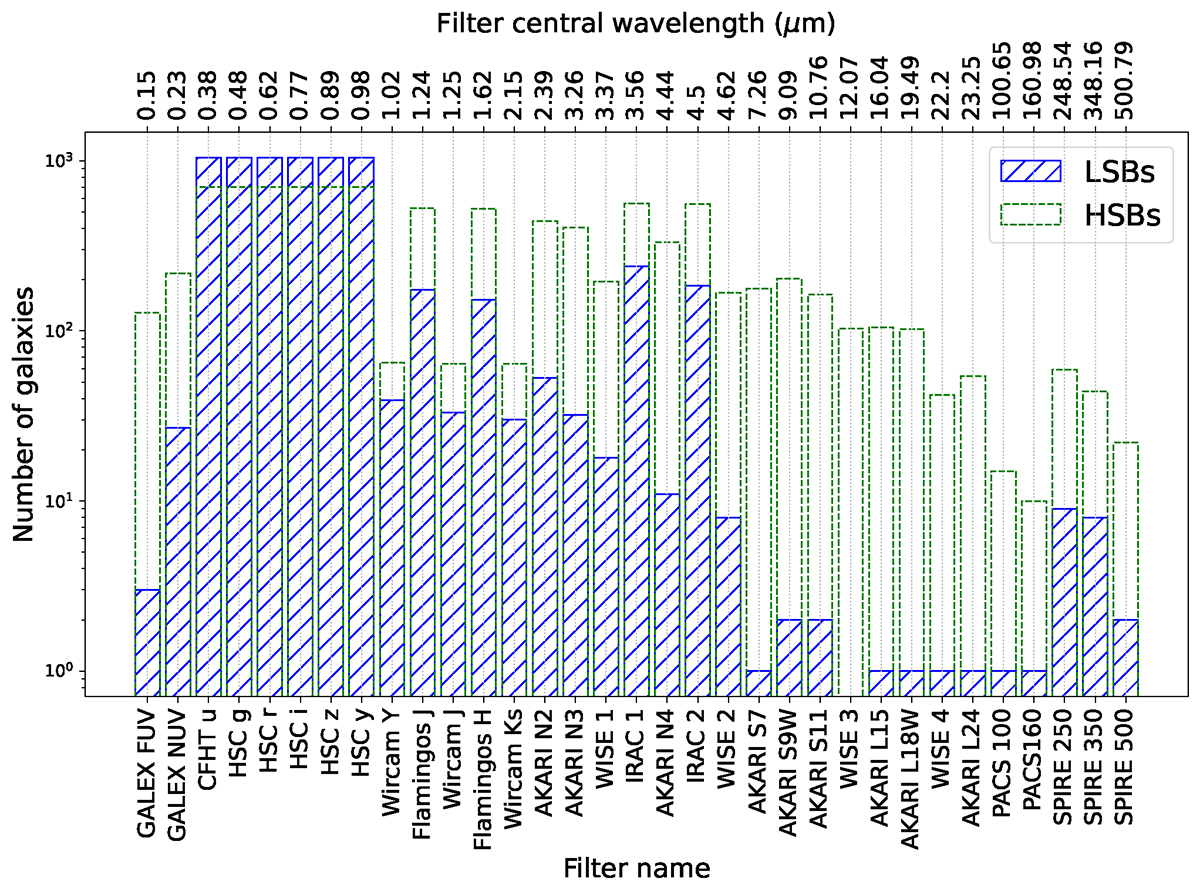
Fig. 3.
Download original image
Distribution of the multiwavelength data available for the sample. The LSBs and HSBs are marked as the blue striped bars and the green dashed bars, respectively. The broadband filter names and their corresponding wavelengths are given in the bottom and top horizontal axes, respectively. All the galaxies in the sample have detection in the ugrizy-bands.
Current usage metrics show cumulative count of Article Views (full-text article views including HTML views, PDF and ePub downloads, according to the available data) and Abstracts Views on Vision4Press platform.
Data correspond to usage on the plateform after 2015. The current usage metrics is available 48-96 hours after online publication and is updated daily on week days.
Initial download of the metrics may take a while.