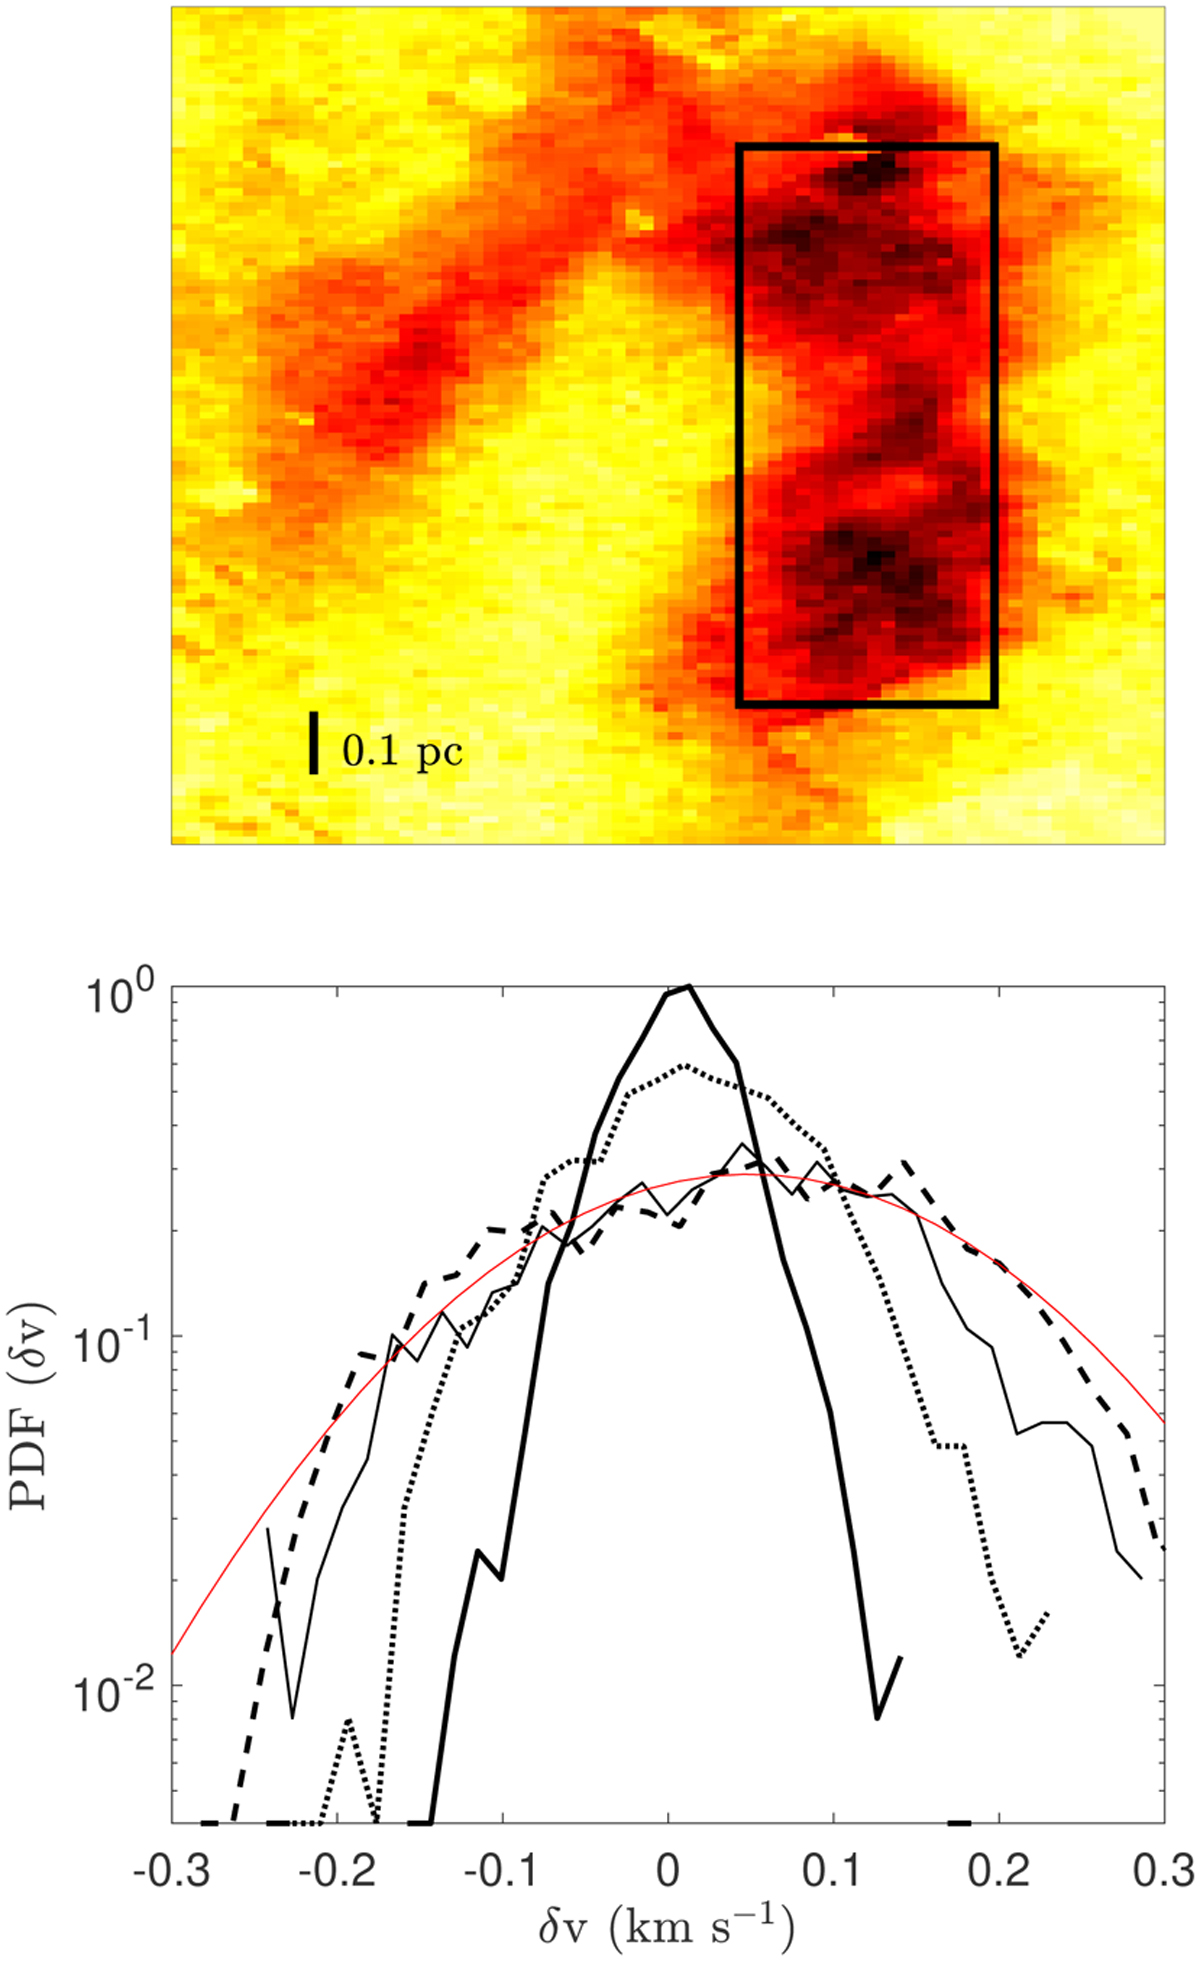
Fig. 9
Download original image
Selected region in west ridge from 12CO FCRAO data for PDFs calculation is shown in the upper panel. The PDFs are computed using only lags in declination. The tick on left corner shows the physical scale. PDFs with different lags applied: δr = 2 (bold solid line), 5 (dotted line), 10 (thin solid line), and 15 (dashed line) are shown in the lower panel. The red line shows a Gaussian fit of δr = 15 PDF.
Current usage metrics show cumulative count of Article Views (full-text article views including HTML views, PDF and ePub downloads, according to the available data) and Abstracts Views on Vision4Press platform.
Data correspond to usage on the plateform after 2015. The current usage metrics is available 48-96 hours after online publication and is updated daily on week days.
Initial download of the metrics may take a while.