Open Access
Fig. 7
Download original image
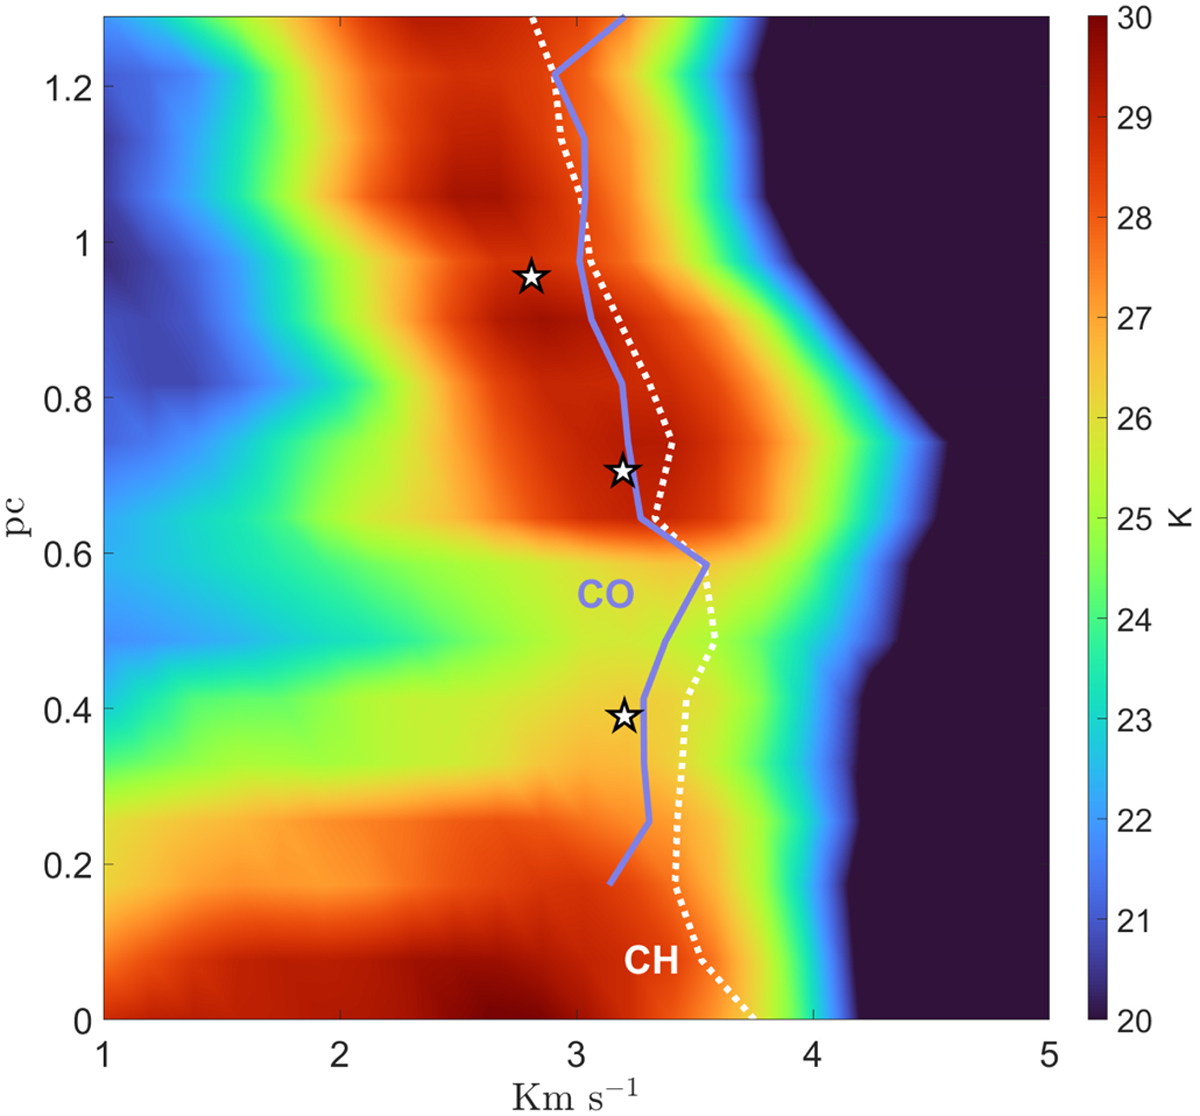
Shear flow in the western ridge of MBM 40. The pseudocolor image is H I. 12CO peak velocities are plotted in blue and CH in dotted white. Stars indicate the mean 13CO peak velocity observed with Onsala telescope in MAP1, MAP2 and MAP4. 12CO missing points below 0.2 pc shows too low S/N.
Current usage metrics show cumulative count of Article Views (full-text article views including HTML views, PDF and ePub downloads, according to the available data) and Abstracts Views on Vision4Press platform.
Data correspond to usage on the plateform after 2015. The current usage metrics is available 48-96 hours after online publication and is updated daily on week days.
Initial download of the metrics may take a while.