Fig. 6
Download original image
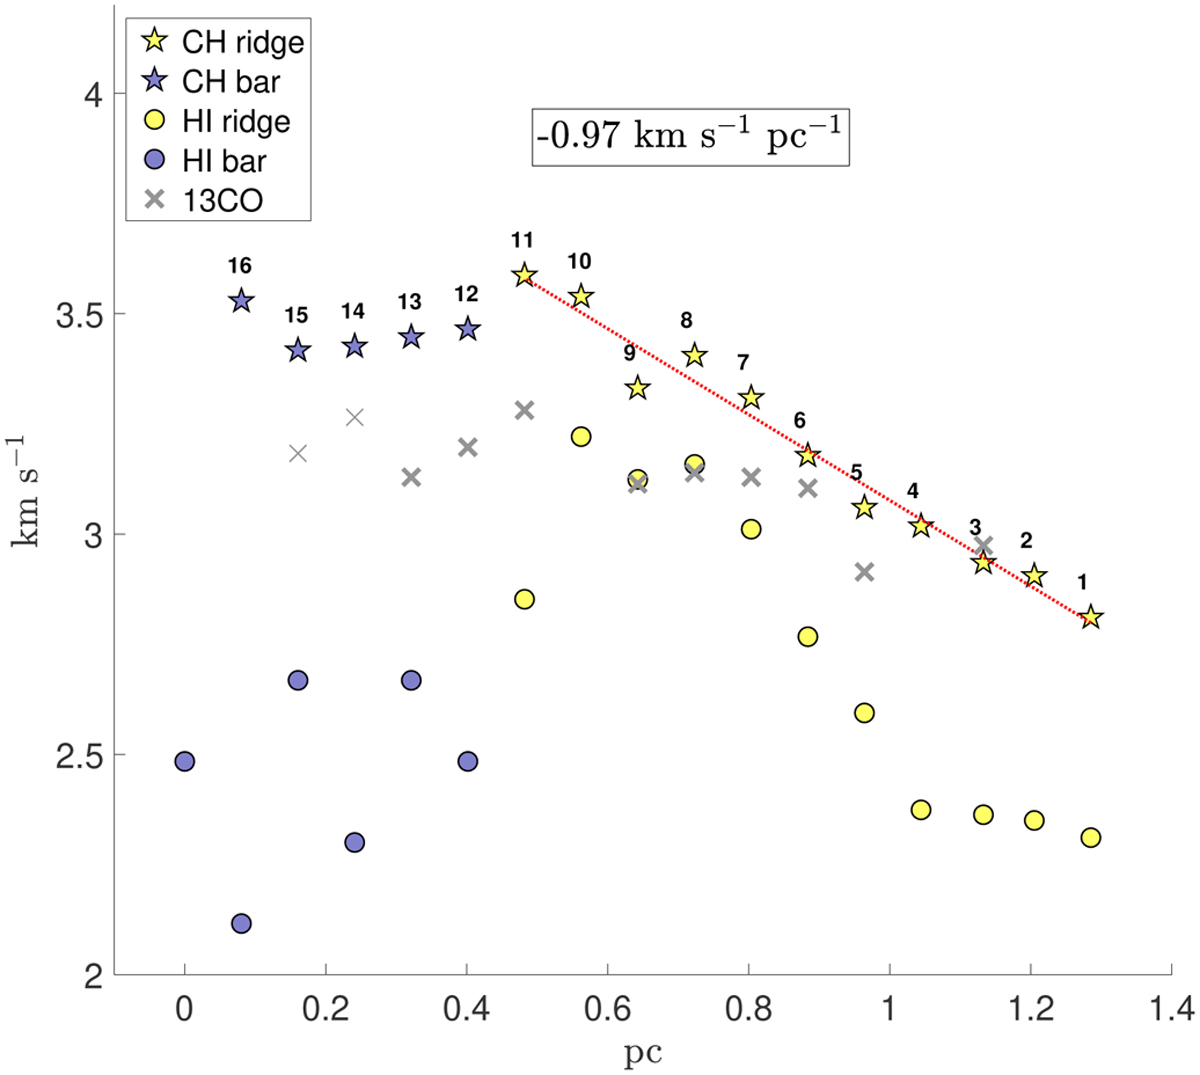
CH, H I, 13CO Gaussian-fitted velocity along the west ridge of the cloud. Each position is quoted as in Fig. 1, blue diamonds. The first two 13CO peak velocities are shown in thin line because here the S/N is too low to trust the Gaussian fit. We converted angular distance into physical distance using the cloud distance of 93 pc (see Zucker et al. 2019). In CH, a linear correlation was found (red dotted line).
Current usage metrics show cumulative count of Article Views (full-text article views including HTML views, PDF and ePub downloads, according to the available data) and Abstracts Views on Vision4Press platform.
Data correspond to usage on the plateform after 2015. The current usage metrics is available 48-96 hours after online publication and is updated daily on week days.
Initial download of the metrics may take a while.