Open Access
Fig. C.1
Download original image
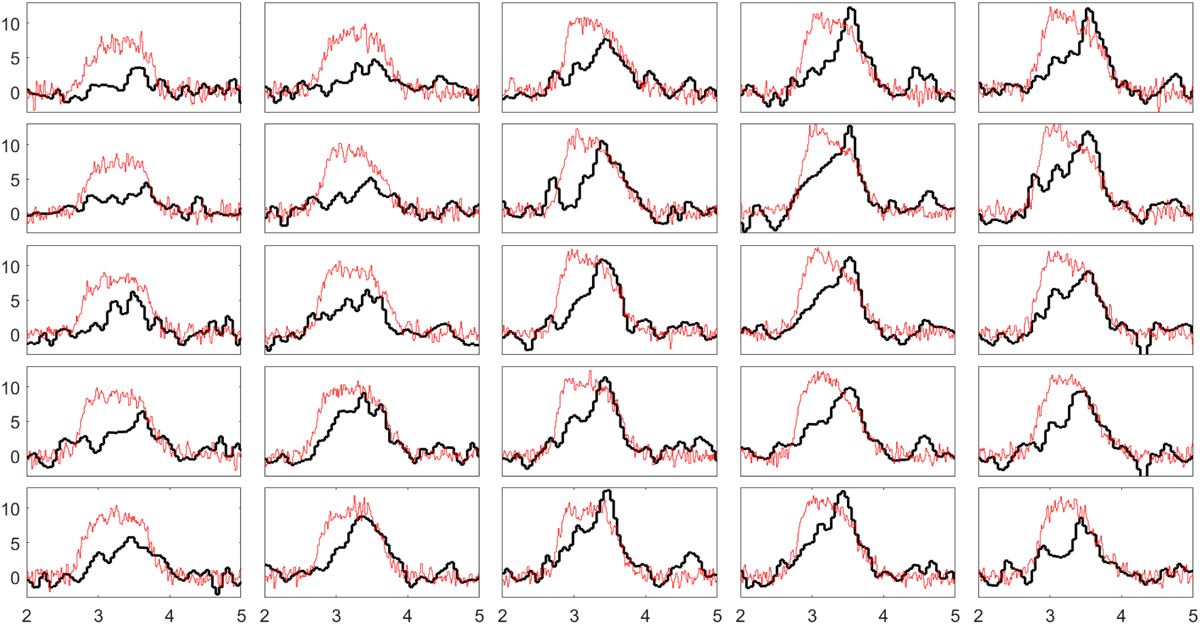
H2CO observations in MAP1 (black thick line), compared with 12CO Onsala observations (red thin line) in the same map. H2CO profiles are inverted and shown for scale to the 12CO peak temperature. Antenna temperature TA in K and vLSR in km s−1.
Current usage metrics show cumulative count of Article Views (full-text article views including HTML views, PDF and ePub downloads, according to the available data) and Abstracts Views on Vision4Press platform.
Data correspond to usage on the plateform after 2015. The current usage metrics is available 48-96 hours after online publication and is updated daily on week days.
Initial download of the metrics may take a while.