Fig. A.1
Download original image
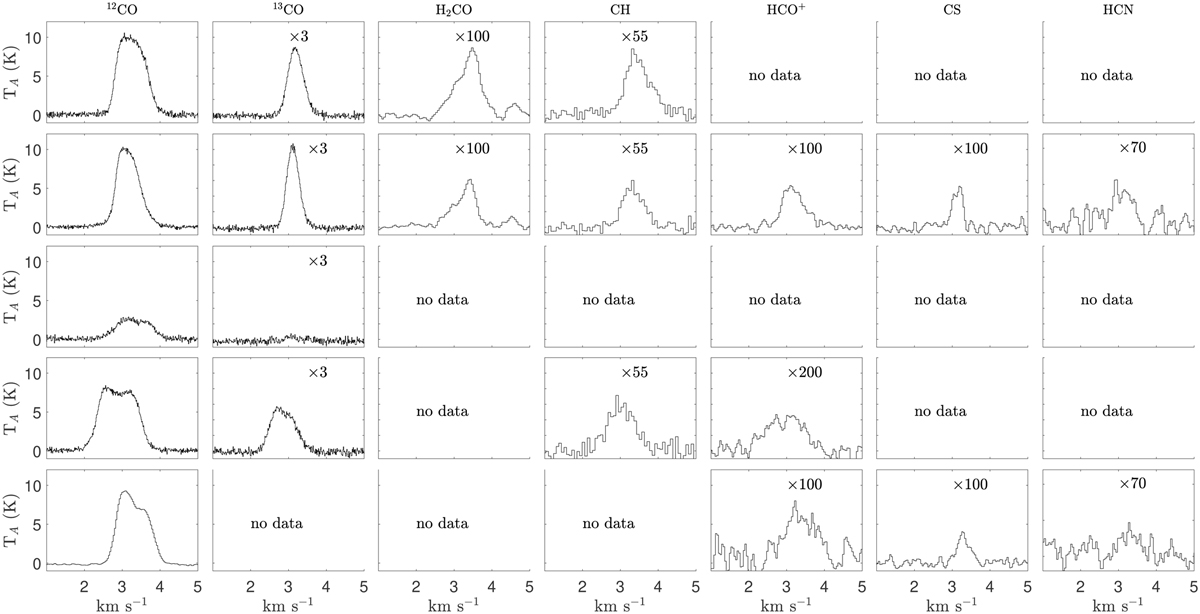
Sample of all observations (from top: MAP1, 2, 3, 4, and Z). When more than one position were observed, the average throughout the map is shown. H2CO is seen in absorption, so we inverted the lines (TA → −TA). Using the ARO telescope, we made also a deep integration in the central point of MAP2 in C3H2 (21,2 − l0,1 85.339 GHz), without any detections.
Current usage metrics show cumulative count of Article Views (full-text article views including HTML views, PDF and ePub downloads, according to the available data) and Abstracts Views on Vision4Press platform.
Data correspond to usage on the plateform after 2015. The current usage metrics is available 48-96 hours after online publication and is updated daily on week days.
Initial download of the metrics may take a while.