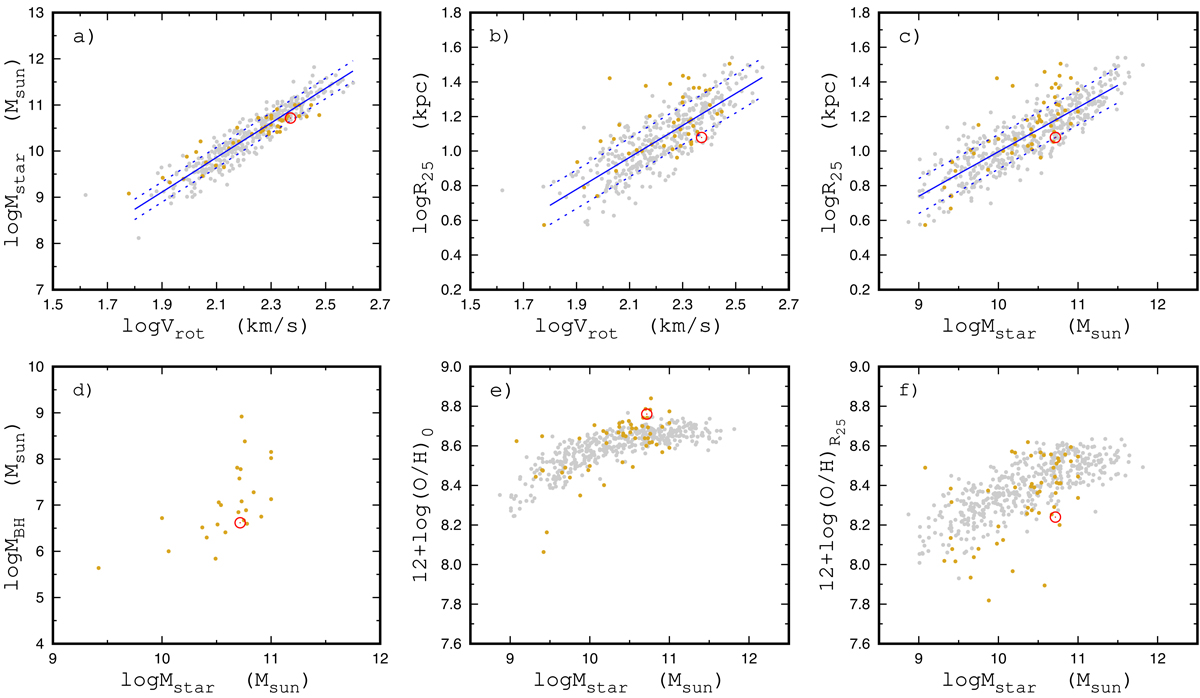
Fig. 5.
Download original image
Comparison of the characteristics of the Milky Way and galaxies from our sample. Panel a: stellar masses M⋆ as a function of rotation velocity Vrot (Tully–Fisher diagram). The grey points in each panel denote individual MaNGA galaxies, while the goldenrod points correspond to nearby galaxies in our sample. The solid line is the linear fit to all the data, while the dotted lines are ±σ deviations. The red circle marks the position of the Milky Way. Panel b: optical radius R25 as a function of rotation velocity Vrot. Panel c: optical radius R25 as a function of stellar mass M⋆. Panel d: black hole mass MBH as a function of stellar mass M⋆. Panel e: central oxygen abundance (O/H)0 as a function of stellar mass M⋆. Panel f: oxygen abundance at the optical radius (O/H)R25 as a function of stellar mass M⋆.
Current usage metrics show cumulative count of Article Views (full-text article views including HTML views, PDF and ePub downloads, according to the available data) and Abstracts Views on Vision4Press platform.
Data correspond to usage on the plateform after 2015. The current usage metrics is available 48-96 hours after online publication and is updated daily on week days.
Initial download of the metrics may take a while.