Fig. 3.
Download original image
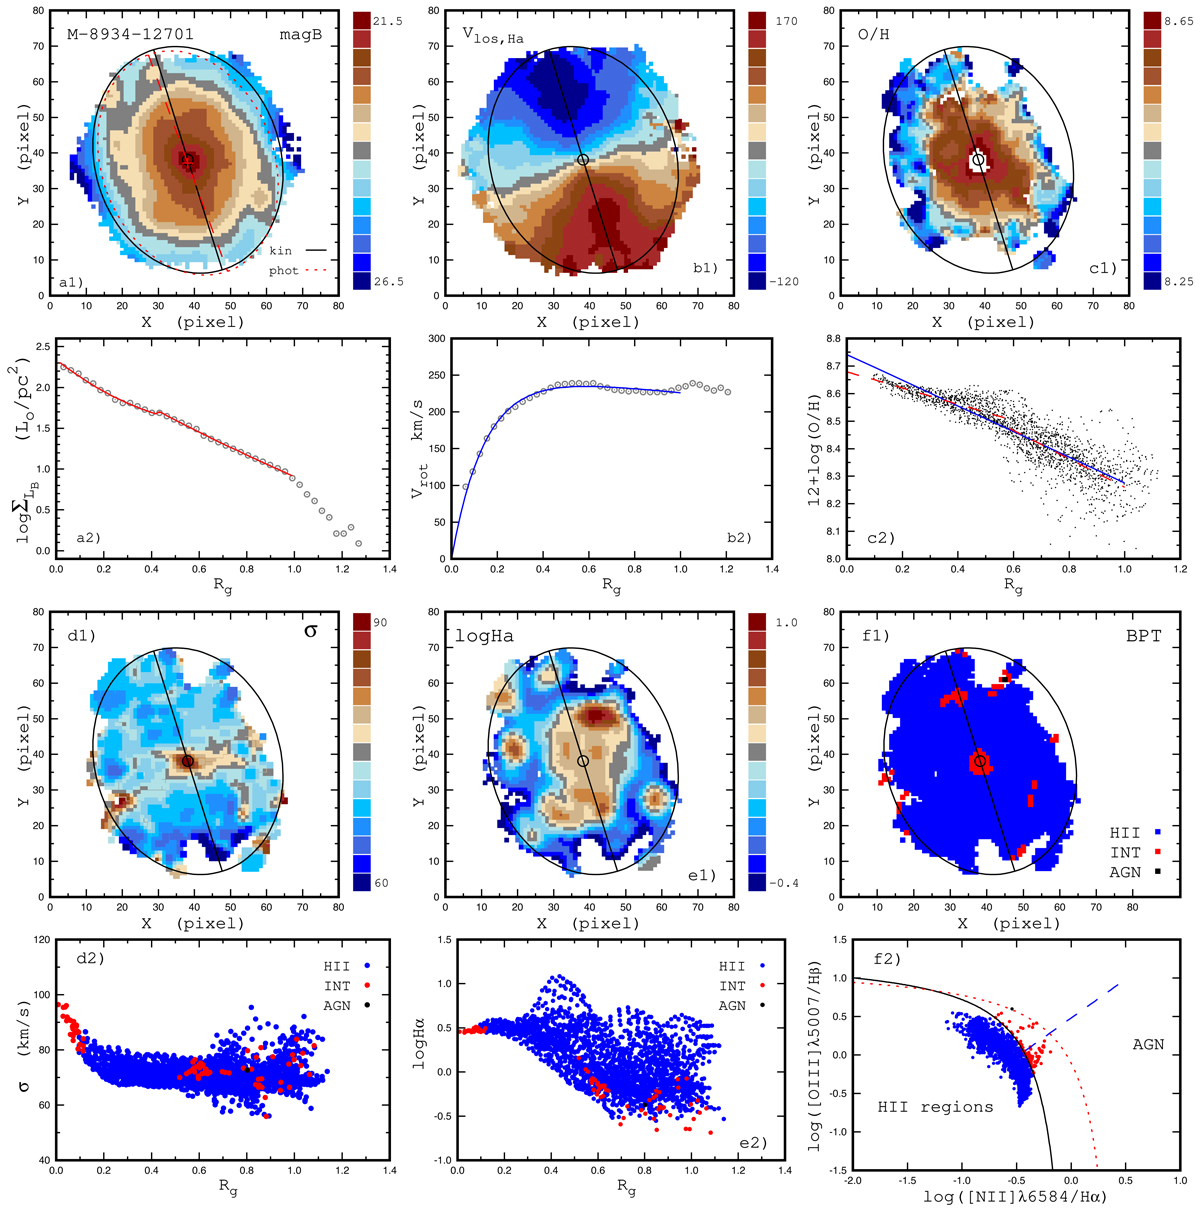
Properties of the MaNGA galaxy M-8934-12701. Panel a1: surface brightness distribution across the image of the galaxy in sky coordinates (pixels). The value of the surface brightness is colour-coded. The circle shows the kinematic centre of the galaxy, the dark solid line indicates the position of the major kinematic axis of the galaxy, and the solid ellipse is the optical radius for kinematic angles. The red cross is the photometric centre, the red dashed line indicates the position of the major photometric axis, and the red dashed ellipse is the optical radius for photometric angles. Panel a2: photometric profile (points) and its fit (line) within the optical radius. Panel b1: line-of-sight velocity field in sky coordinates. Panel b2: rotation velocity curve (points) and its fit (line) within the optical radius. Panel c1: oxygen abundance map. Panel c2: radial abundance distribution. The grey points denote the abundances for the individual spaxels, the solid line is the simple linear fit to those data, while the dashed line is the broken linear fit to the same data. Panel d1: map of the gas velocity dispersion σ. Panel d2: radial distribution of the gas velocity dispersion σ in the disc. The coloured circles denote the gas velocity dispersion for the individual spaxels of H II region-like (blue symbols), intermediate (red symbols), and AGN-like (black symbols) spectra classification. Panel e1: map of the measured flux in the Hα emission line per spaxel in units of 10−17 erg s−1 cm−2/spaxel. Panel e2: radial distribution of the measured Hα flux. The coloured circles denote the flux for the individual spaxels of H-region-like (blue symbols), intermediate (red symbols), and AGN-like (black symbols) spectra classification. Panel f1: map of the BPT spectra classification. The BPT types of radiation for the individual spaxels are colour-coded. Panel f2: BPT diagram for the individual spaxels colour-coded by H II region-like (blue symbols), intermediate (red symbols), and AGN-like (black symbols) spectra. Solid and short-dashed curves mark the demarcation line between AGNs and H II regions defined by Kauffmann et al. (2003) and Kewley et al. (2001), respectively. The long-dashed line is the dividing line between Seyfert galaxies and LINERs defined by Cid et al. (2010).
Current usage metrics show cumulative count of Article Views (full-text article views including HTML views, PDF and ePub downloads, according to the available data) and Abstracts Views on Vision4Press platform.
Data correspond to usage on the plateform after 2015. The current usage metrics is available 48-96 hours after online publication and is updated daily on week days.
Initial download of the metrics may take a while.