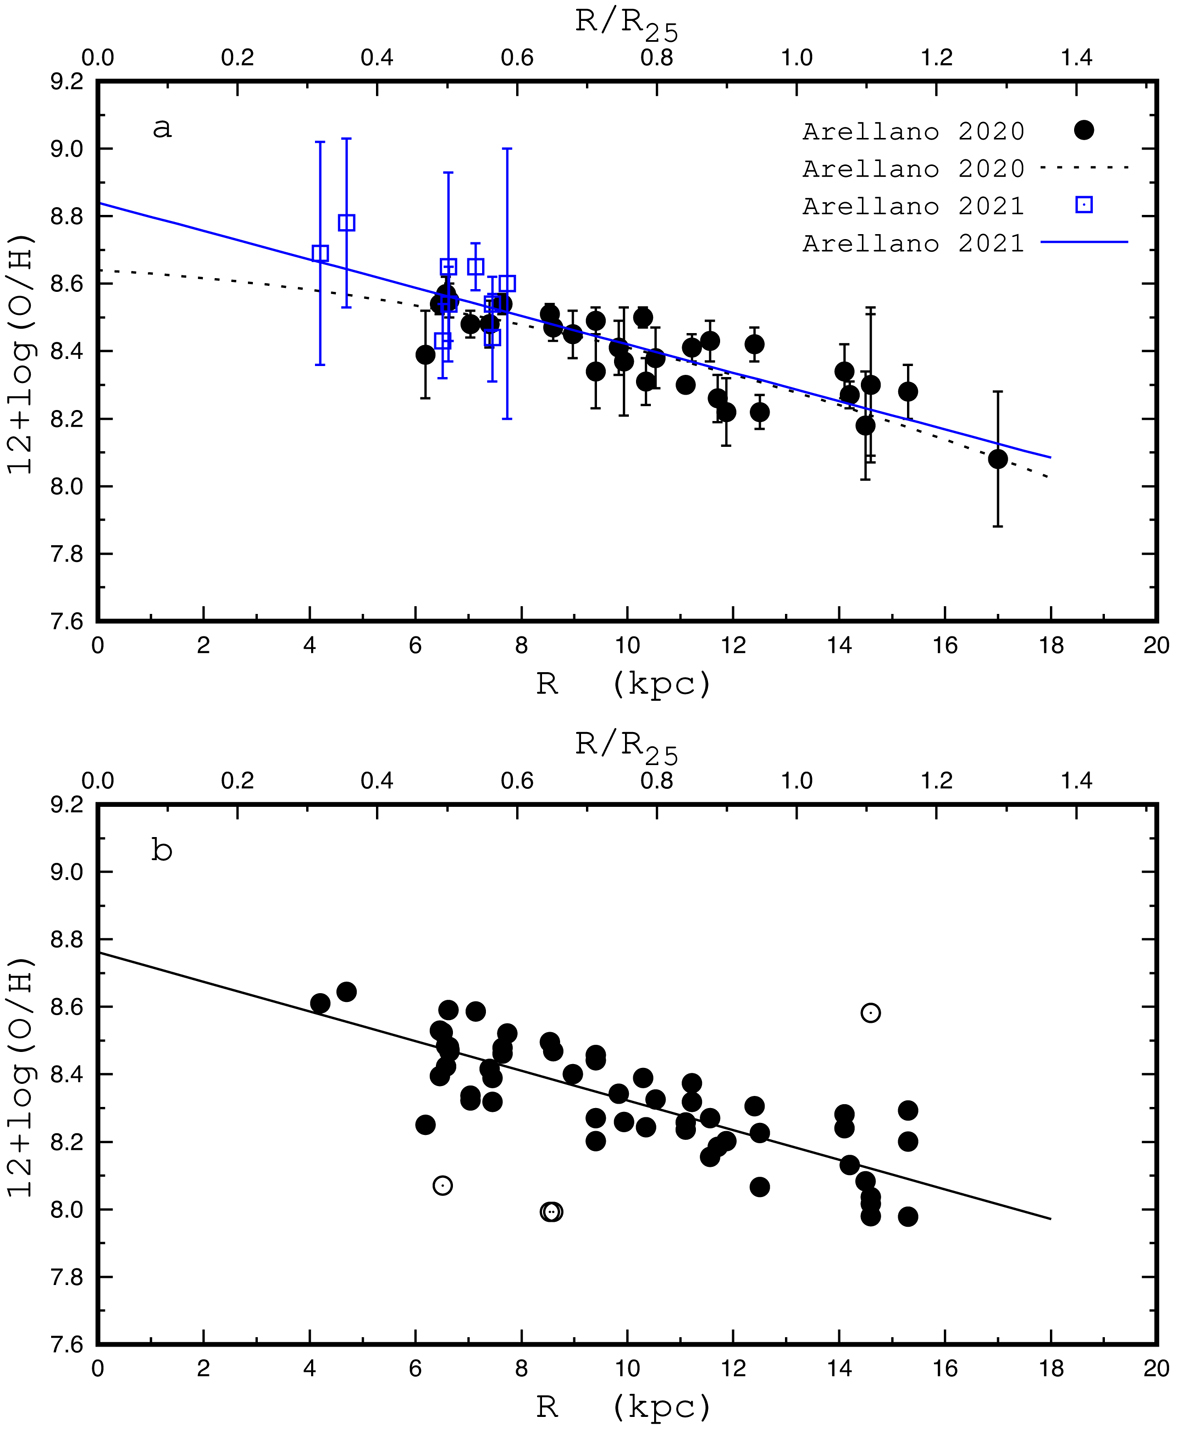
Fig. 2.
Download original image
Radial oxygen abundance distribution in the Milky Way. Panel a: radial abundance gradients obtained by Arellano-Córdova et al. (2020, 2021). The black circles designate the H II regions from Arellano-Córdova et al. (2020). The dashed black curve is the quadratic fit to those data. The blue squares mark the H II regions from Arellano-Córdova et al. (2021). The solid blue line shows the linear fit to all the data. Panel b: radial abundance distribution in the Milky Way obtained in this work (see text). The black circles denote the H II regions used in the determination of the radial abundance gradient (solid line). The open circles designate the H II regions excluded from the determination of the abundance gradient.
Current usage metrics show cumulative count of Article Views (full-text article views including HTML views, PDF and ePub downloads, according to the available data) and Abstracts Views on Vision4Press platform.
Data correspond to usage on the plateform after 2015. The current usage metrics is available 48-96 hours after online publication and is updated daily on week days.
Initial download of the metrics may take a while.