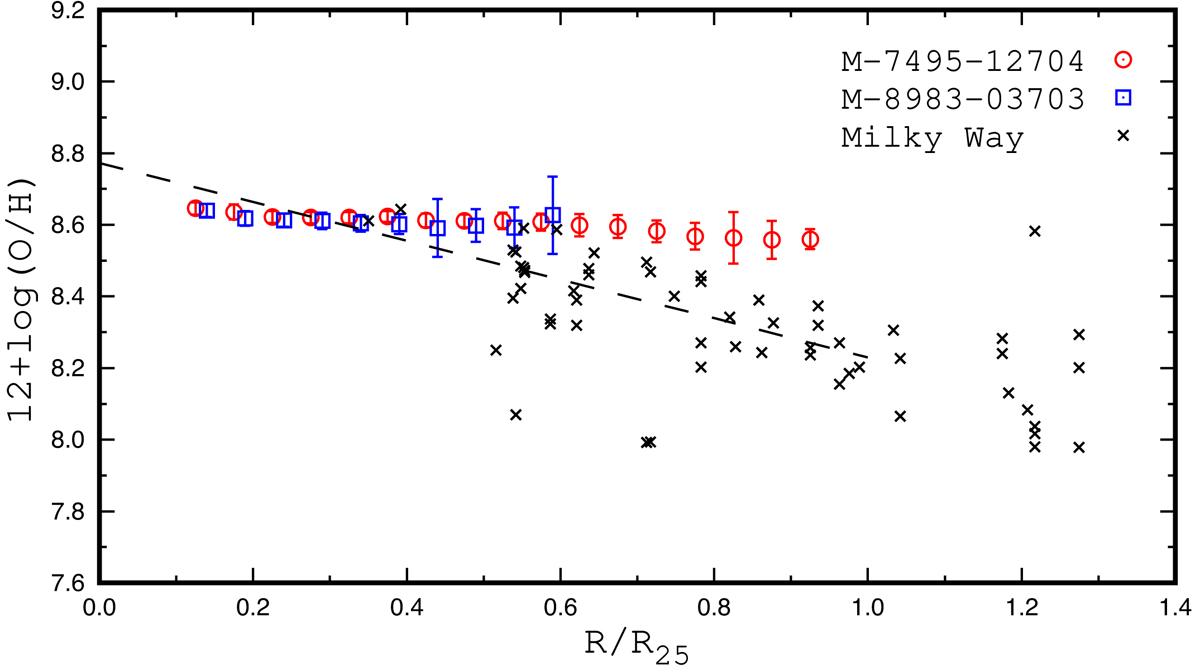
Fig. 13.
Download original image
Comparison between the radial oxygen abundance distributions in the MaNGA galaxy M-8983-03703 and the Milky Way. The blue squares are the median values of O/H in bins of 0.05 in the fractional radius R/R25 of M-8983-03703, and the bars show the scatter in O/H around the median values of the bins. The red circles are abundances estimated from other MaNGA measurements (M-7495-12704) of this galaxy. The median values of the oxygen abundances for different measurements were obtained for the same bin, but the positions of the symbols (circles and squares) were shifted slightly along the x-axis for the sake of clarity. The black crosses denote the Te-based abundances of individual H II regions in the Milky Way, while the solid line is the best fit to those data within the optical radius.
Current usage metrics show cumulative count of Article Views (full-text article views including HTML views, PDF and ePub downloads, according to the available data) and Abstracts Views on Vision4Press platform.
Data correspond to usage on the plateform after 2015. The current usage metrics is available 48-96 hours after online publication and is updated daily on week days.
Initial download of the metrics may take a while.