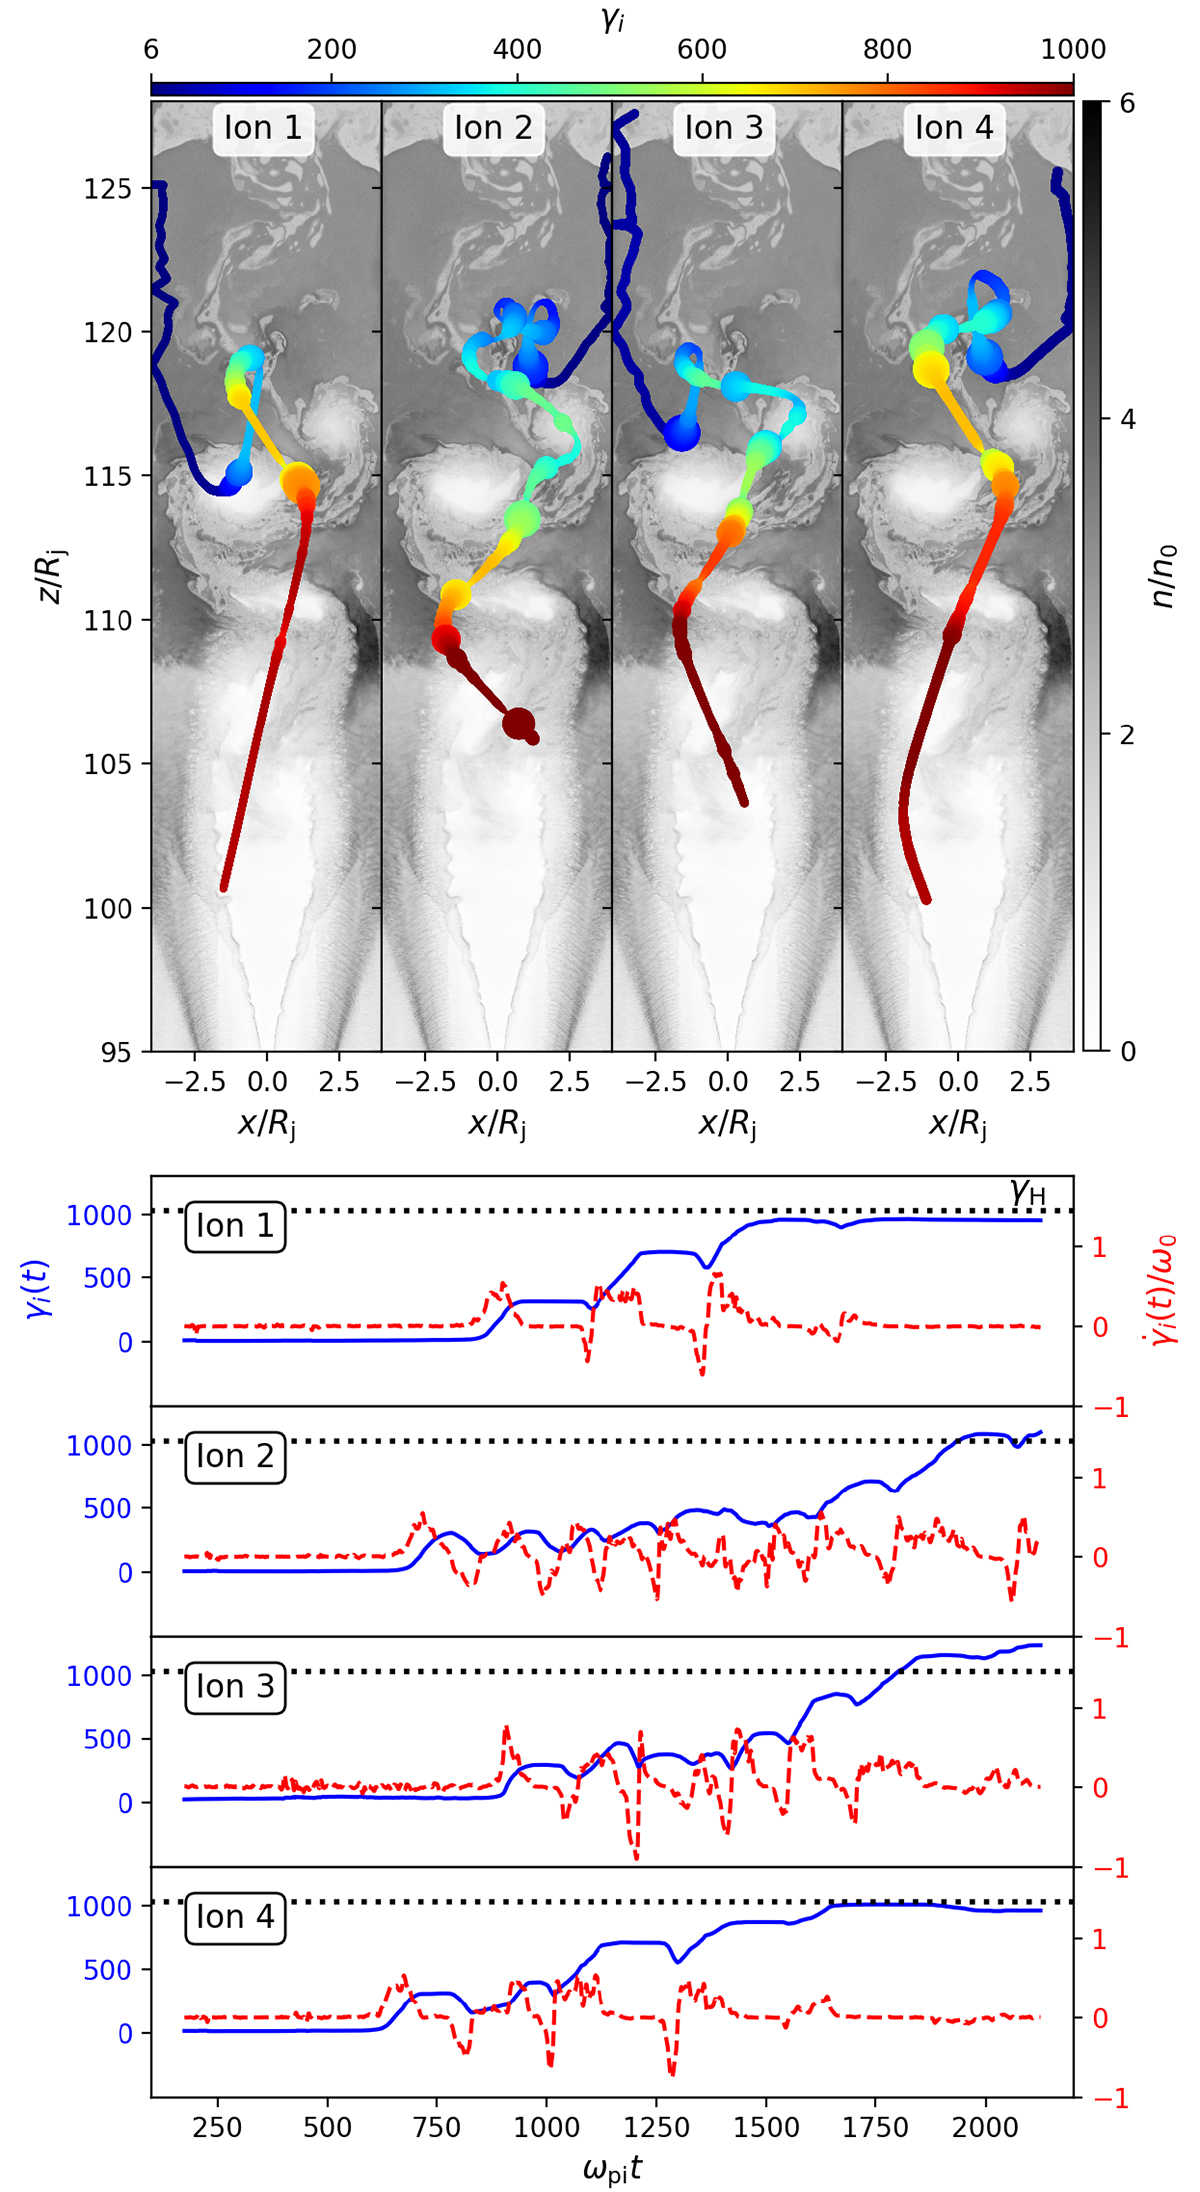
Fig. 6.
Download original image
Acceleration history of four representative high-energy ion trajectories tracked from their injection at ωpit = 175 up to ωpit ≳ 2000 where they have all reached the jet confinement limit. Top: full ion trajectory superimposed onto the final plasma density map (gray scale). The color indicates the particle Lorentz factor γi, while the marker size codes for the acceleration rate ![]() , where ω0 = eB0/mic, a large marker means a high positive rate while a small marker is for negative rates. Bottom: time evolution of the ion Lorentz factor (blue solid line) and acceleration rate (red dashed line).
, where ω0 = eB0/mic, a large marker means a high positive rate while a small marker is for negative rates. Bottom: time evolution of the ion Lorentz factor (blue solid line) and acceleration rate (red dashed line).
Current usage metrics show cumulative count of Article Views (full-text article views including HTML views, PDF and ePub downloads, according to the available data) and Abstracts Views on Vision4Press platform.
Data correspond to usage on the plateform after 2015. The current usage metrics is available 48-96 hours after online publication and is updated daily on week days.
Initial download of the metrics may take a while.