Fig. 5.
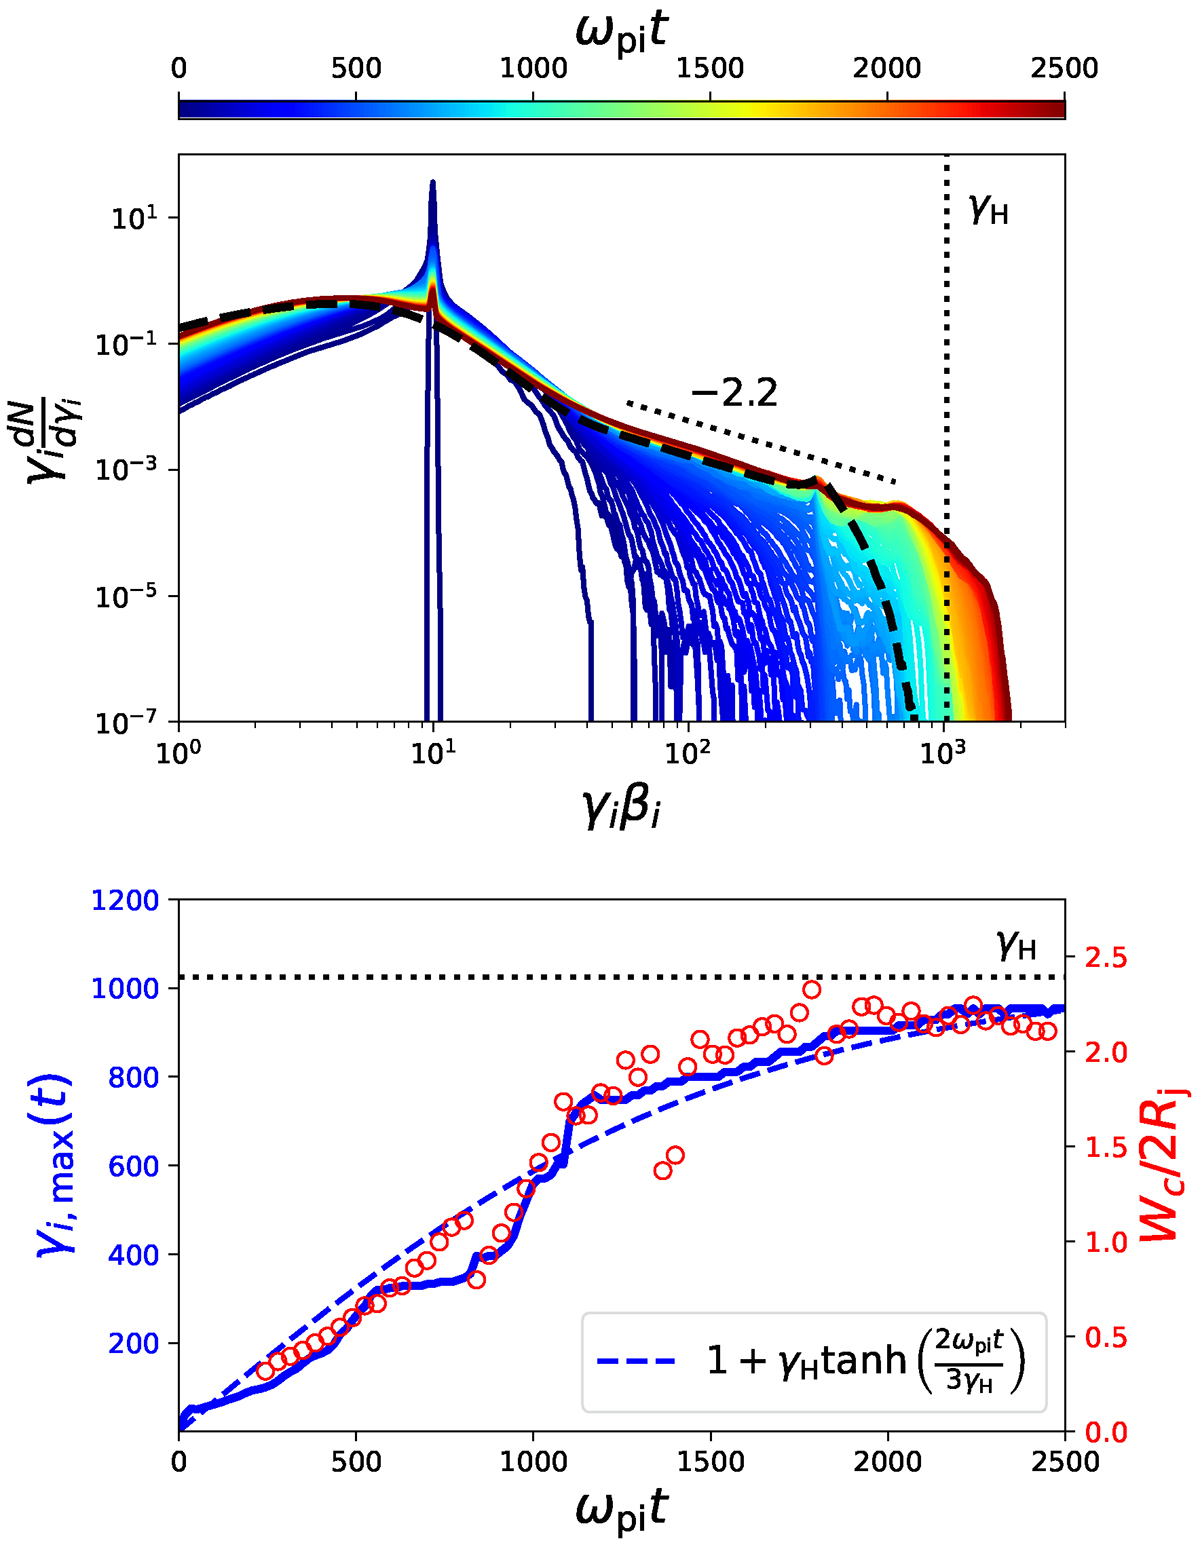
Download original image
Particle acceleration up to the confinement limit of the system. Top panel: time evolution of the total ion spectrum γidN/dγi (color-coded solid lines). The final total electron spectrum is shown for comparison as a function of γeβe × (me/mi) to compare the energy scales rather than the Lorentz factors between the two species (black dashed line). A −2.2 power-law slope is shown for comparison (dotted line). Bottom panel: time evolution of the maximum ion Lorentz factor γi, max (blue solid line) and the latitudinal width of the shock front cavity normalized to the full jet width (Wc, red circles). The jet confinement limit, γH, is marked by the horizontal dotted line. The blue dashed line shows a simple empirical formula that captures the time evolution of γi, max.
Current usage metrics show cumulative count of Article Views (full-text article views including HTML views, PDF and ePub downloads, according to the available data) and Abstracts Views on Vision4Press platform.
Data correspond to usage on the plateform after 2015. The current usage metrics is available 48-96 hours after online publication and is updated daily on week days.
Initial download of the metrics may take a while.