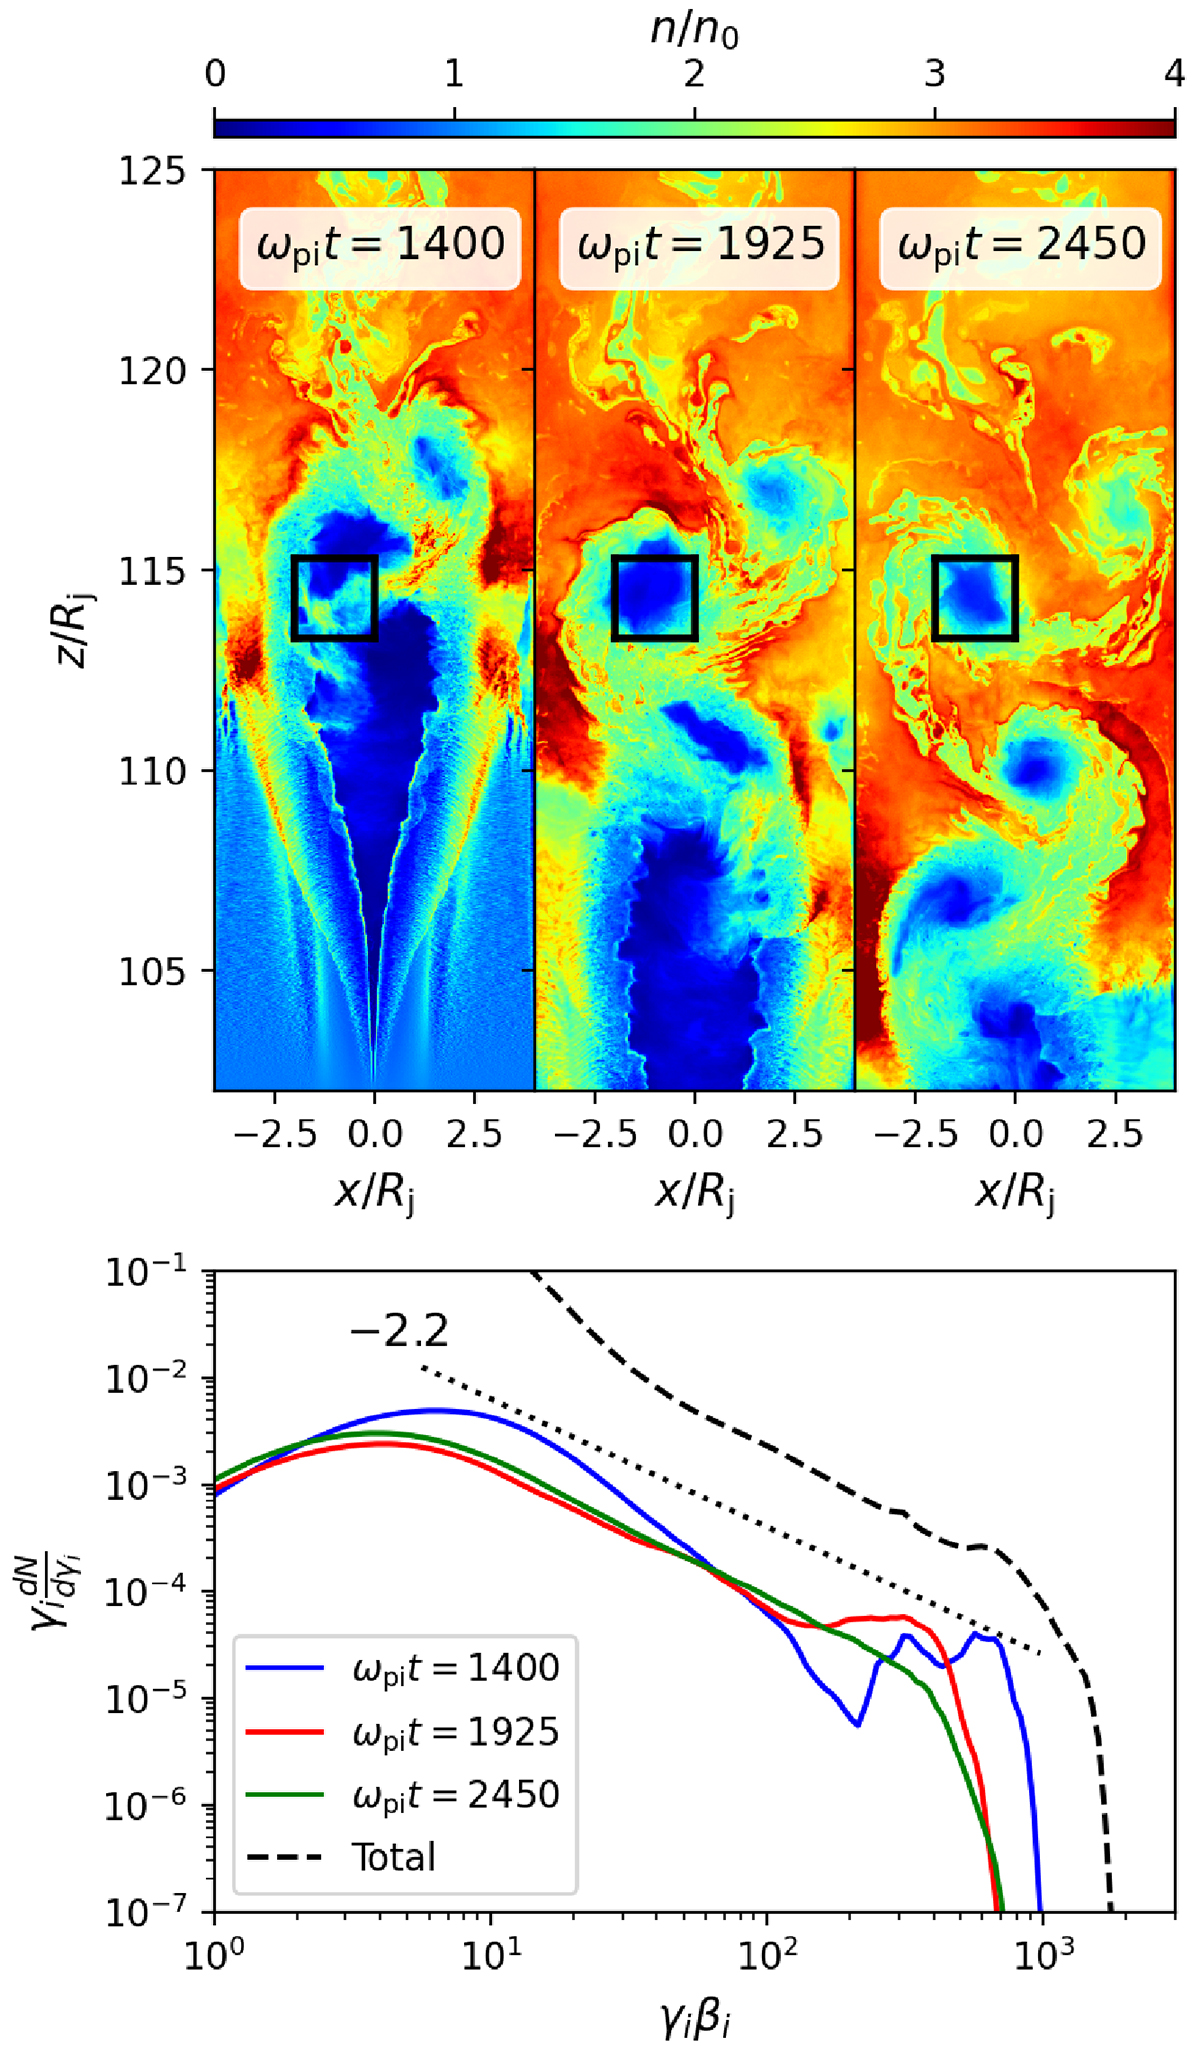
Fig. 3.
Download original image
Zoomed-in view and time evolution of the von Kármán vortex street. The top panels shows the formation of a vortex that was carved out of the shock front cavity, and its later evolution in the downstream medium. The bottom panel shows the evolution of the ion spectrum within the vortex encapsulated in the box drawn in the upper panels. The total final ion spectrum is shown for comparison with the black dashed line.
Current usage metrics show cumulative count of Article Views (full-text article views including HTML views, PDF and ePub downloads, according to the available data) and Abstracts Views on Vision4Press platform.
Data correspond to usage on the plateform after 2015. The current usage metrics is available 48-96 hours after online publication and is updated daily on week days.
Initial download of the metrics may take a while.