Fig. 2.
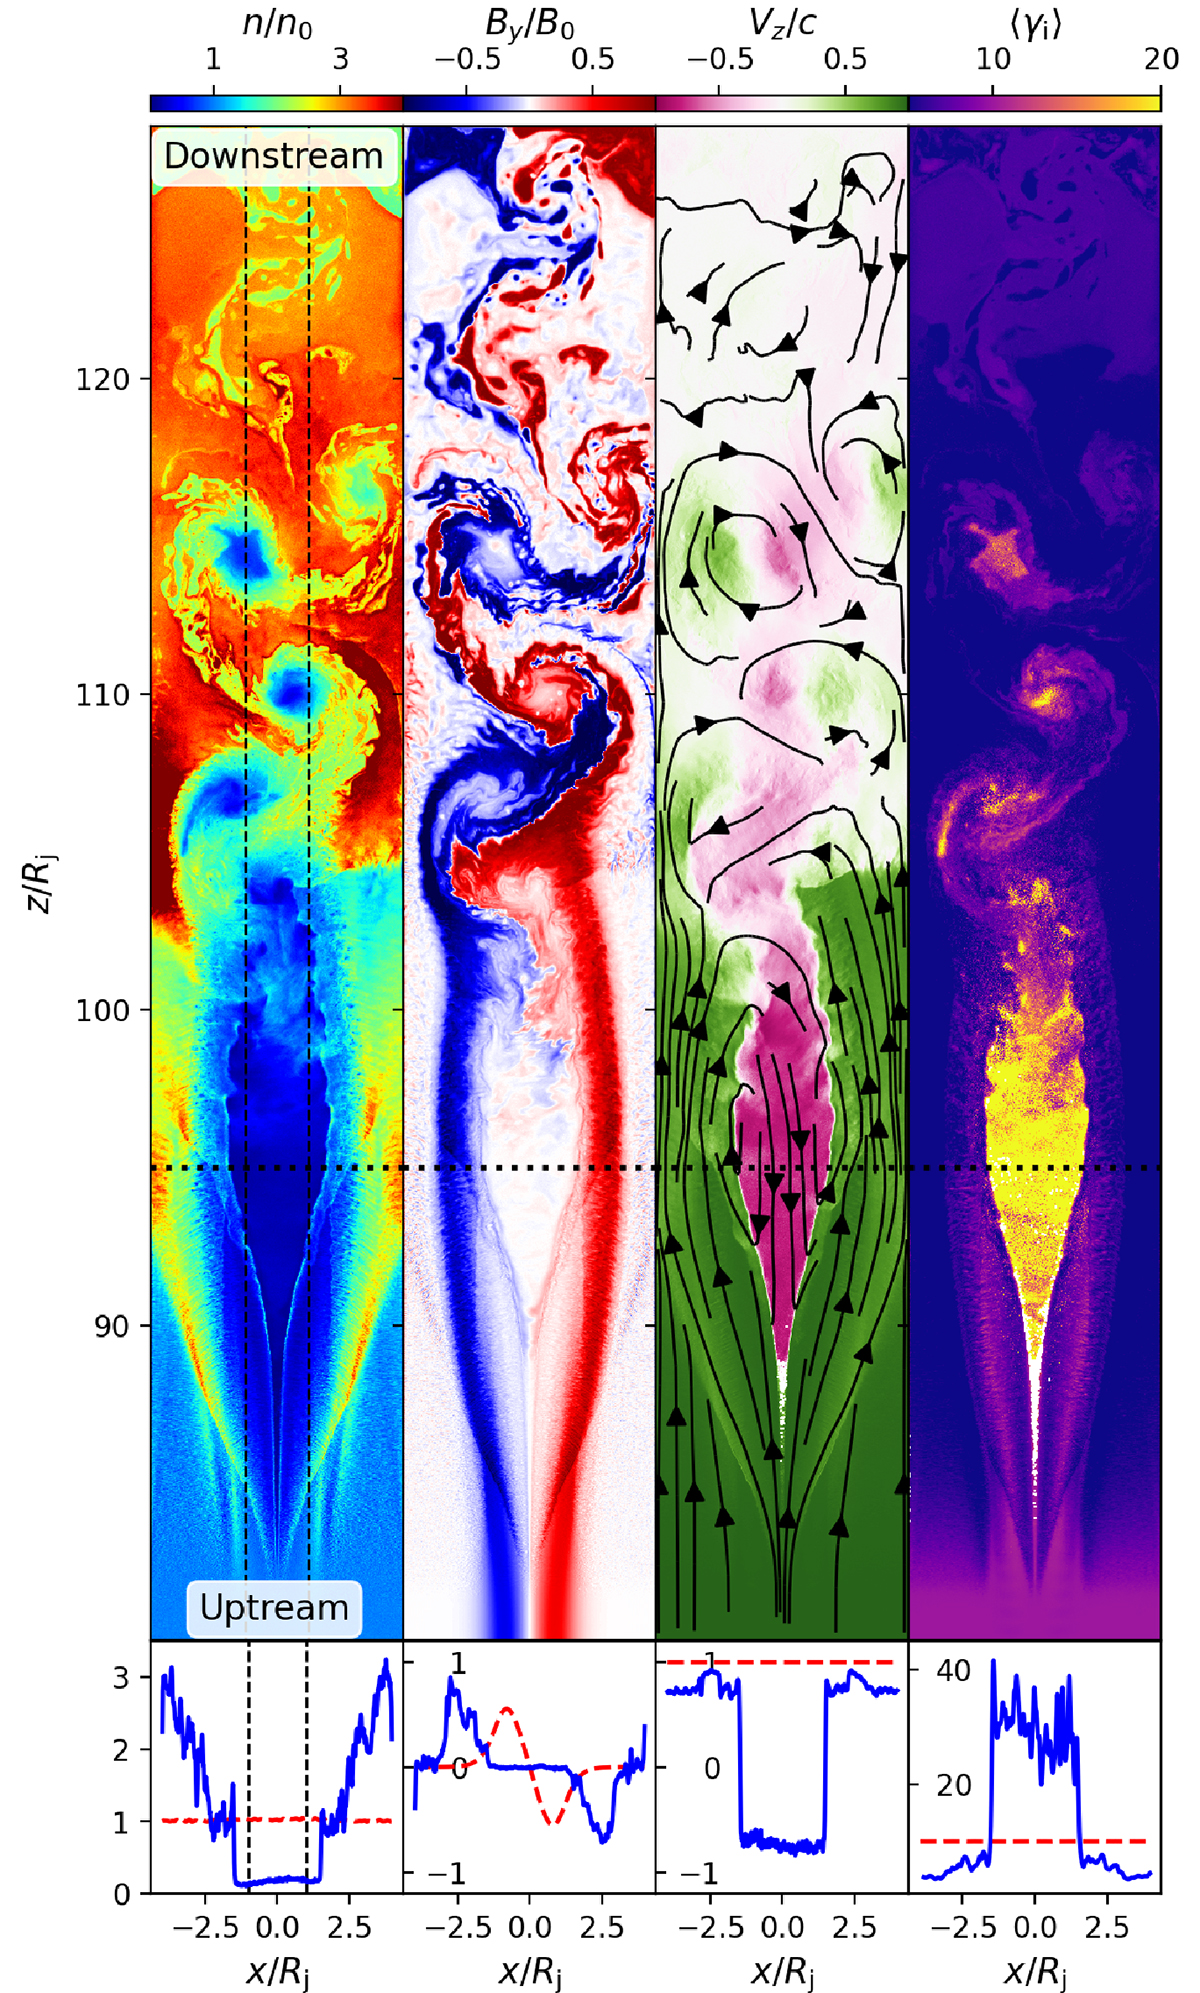
Download original image
Structure of the jet termination shock in the final state of the fiducial simulation at ωpit = 2500. From left to right, this figure shows the following: the plasma density n/n0, the out-of-plane magnetic field component (By/B0), the axial plasma bulk velocity (Vz/c) and streamlines (solid contour lines with arrows), as well as the mean individual ion Lorentz factor ⟨γi⟩. The lower panels show the radial profile of each quantity across the large plasma cavity at z ≈ 95Rj (blue solid line), which can be compared with the upstream solution (red dashed line).
Current usage metrics show cumulative count of Article Views (full-text article views including HTML views, PDF and ePub downloads, according to the available data) and Abstracts Views on Vision4Press platform.
Data correspond to usage on the plateform after 2015. The current usage metrics is available 48-96 hours after online publication and is updated daily on week days.
Initial download of the metrics may take a while.