Open Access
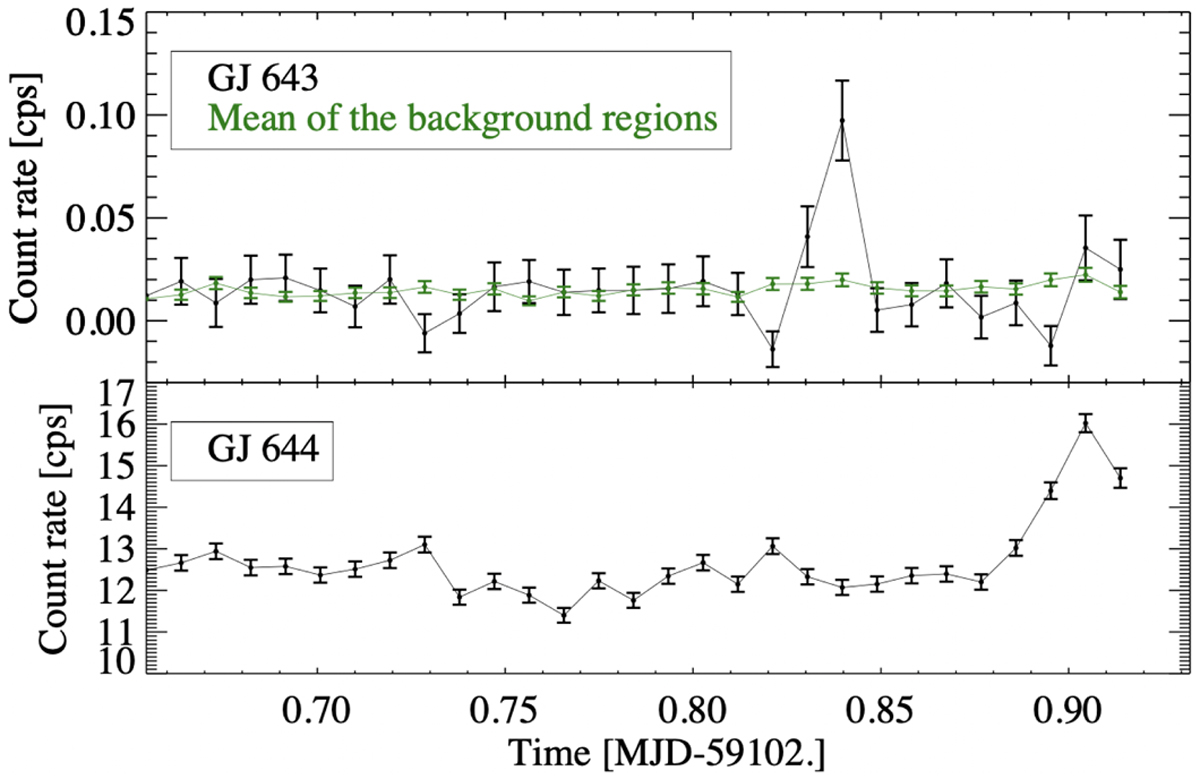
Fig. A.2
Download original image
EPIC/pn background subtracted lightcurve of GJ 643 (black) and the light curve of its background (green), averaged over three regions shown at the top (see Fig. A.1). Lower panel shows, for comparison, the light curve of GJ 644 AB.
Current usage metrics show cumulative count of Article Views (full-text article views including HTML views, PDF and ePub downloads, according to the available data) and Abstracts Views on Vision4Press platform.
Data correspond to usage on the plateform after 2015. The current usage metrics is available 48-96 hours after online publication and is updated daily on week days.
Initial download of the metrics may take a while.