Fig. 5
Download original image
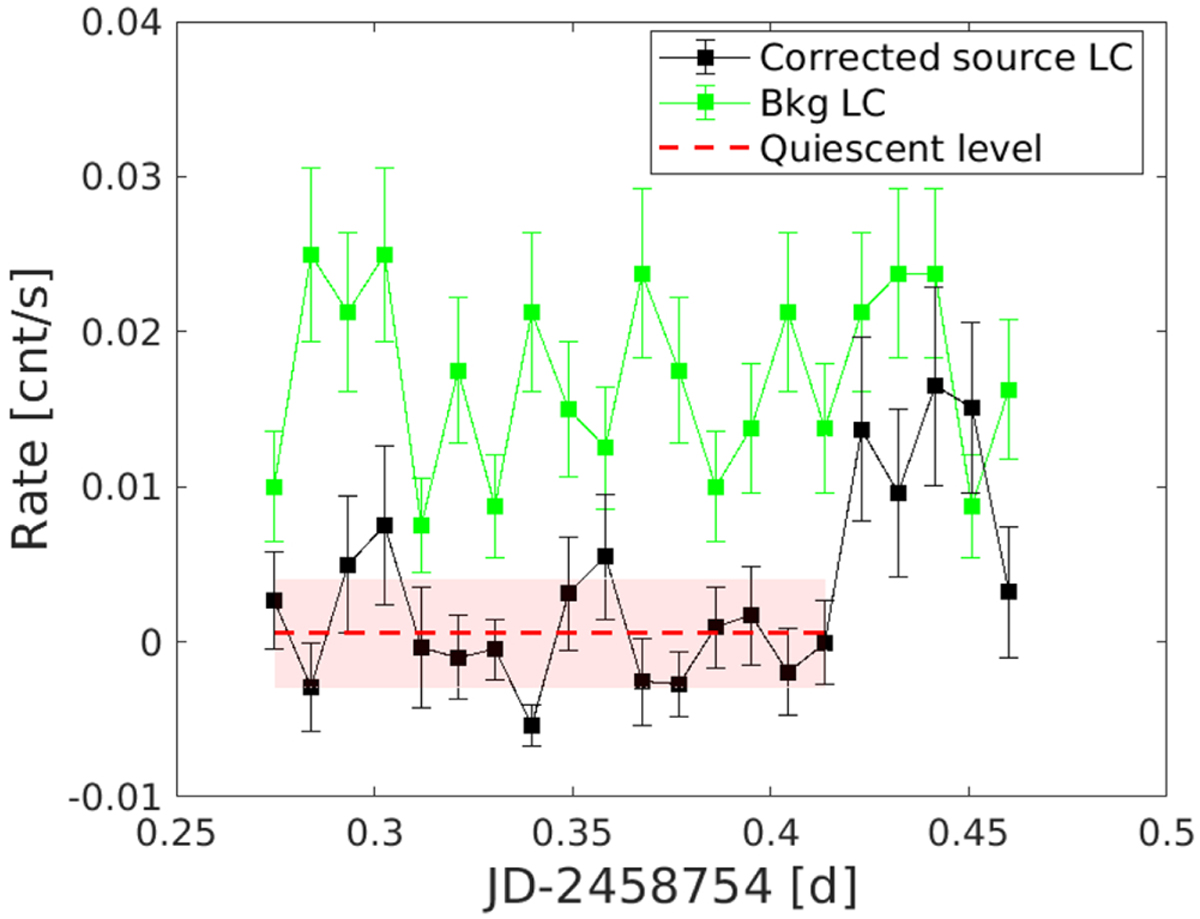
Background-subtracted EPIC/pn light curve of GJ 745 B (black) and light curve of the background (green), both with a bin size of 800 s (see Sect. 4.2.1). We also show the quiescent rate with its standard deviation (red dashed line and shade, respectively) that we adopted for the calculation of the flare energy as explained in Sect. 4.2.2. The light curve is shorter than the nominal exposure time due to high and variable background at the end of the observation.
Current usage metrics show cumulative count of Article Views (full-text article views including HTML views, PDF and ePub downloads, according to the available data) and Abstracts Views on Vision4Press platform.
Data correspond to usage on the plateform after 2015. The current usage metrics is available 48-96 hours after online publication and is updated daily on week days.
Initial download of the metrics may take a while.