Fig. 8.
Download original image
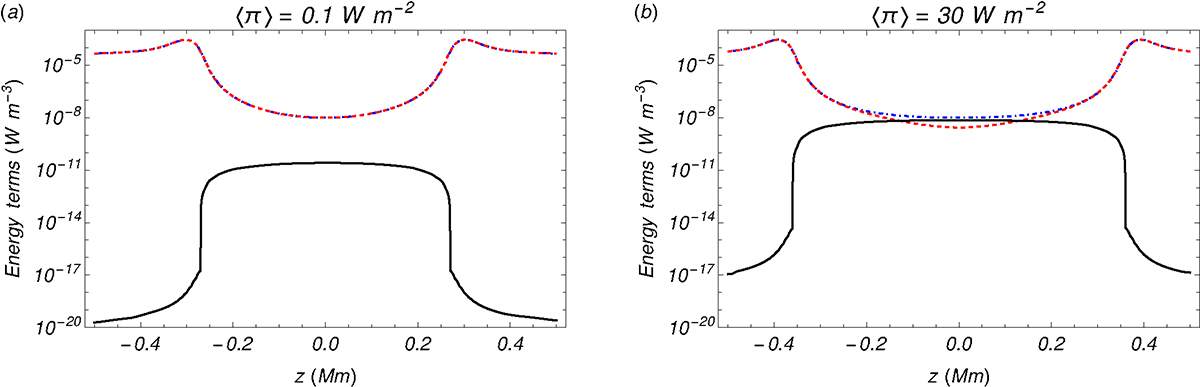
Comparison of the various terms in the energy balance equation (Eq. (2)) in models with T0 = 9000 K and two values of the injected wave energy flux: (a) ⟨π⟩= 0.1 W m−2 and (b) ⟨π⟩= 30 W m−2. The solid black line corresponds to the wave heating rate, the dot-dashed blue line denotes radiative losses, and the dashed red line represents the thermal conduction term. Only a close-up view of the central part and the PCTR of the thread are displayed.
Current usage metrics show cumulative count of Article Views (full-text article views including HTML views, PDF and ePub downloads, according to the available data) and Abstracts Views on Vision4Press platform.
Data correspond to usage on the plateform after 2015. The current usage metrics is available 48-96 hours after online publication and is updated daily on week days.
Initial download of the metrics may take a while.