Open Access
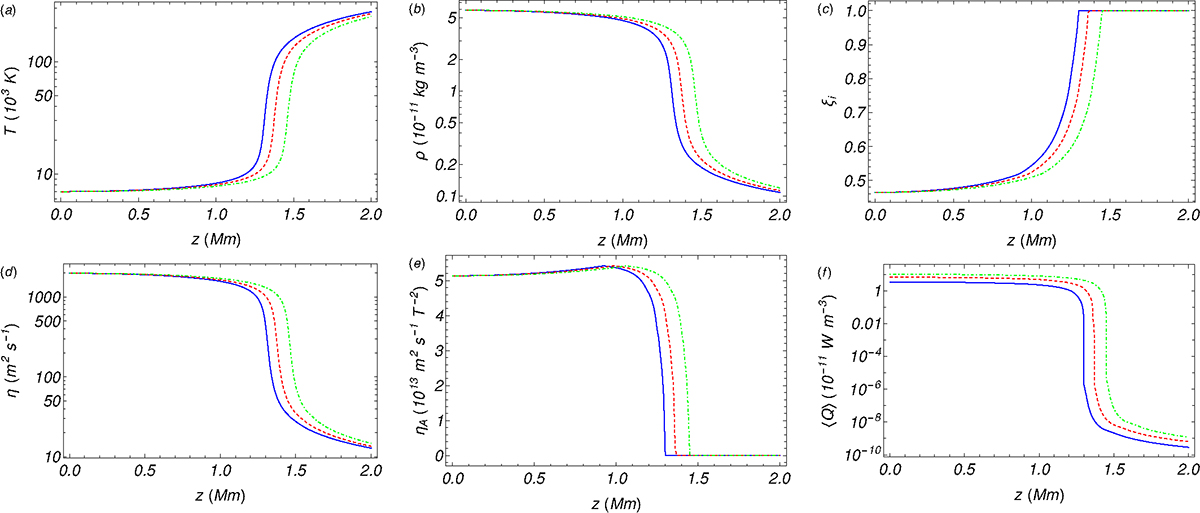
Fig. 7.
Download original image
Same as Fig. 6 but with T0 = 7000 K and three different values of injected wave energy flux. The values of the injected wave energy flux are ⟨π⟩= 0.2 W m−2 (solid blue line), ⟨π⟩= 0.4 W m−2 (dashed red line), and ⟨π⟩= 0.8 W m−2 (dash-dotted green line).
Current usage metrics show cumulative count of Article Views (full-text article views including HTML views, PDF and ePub downloads, according to the available data) and Abstracts Views on Vision4Press platform.
Data correspond to usage on the plateform after 2015. The current usage metrics is available 48-96 hours after online publication and is updated daily on week days.
Initial download of the metrics may take a while.