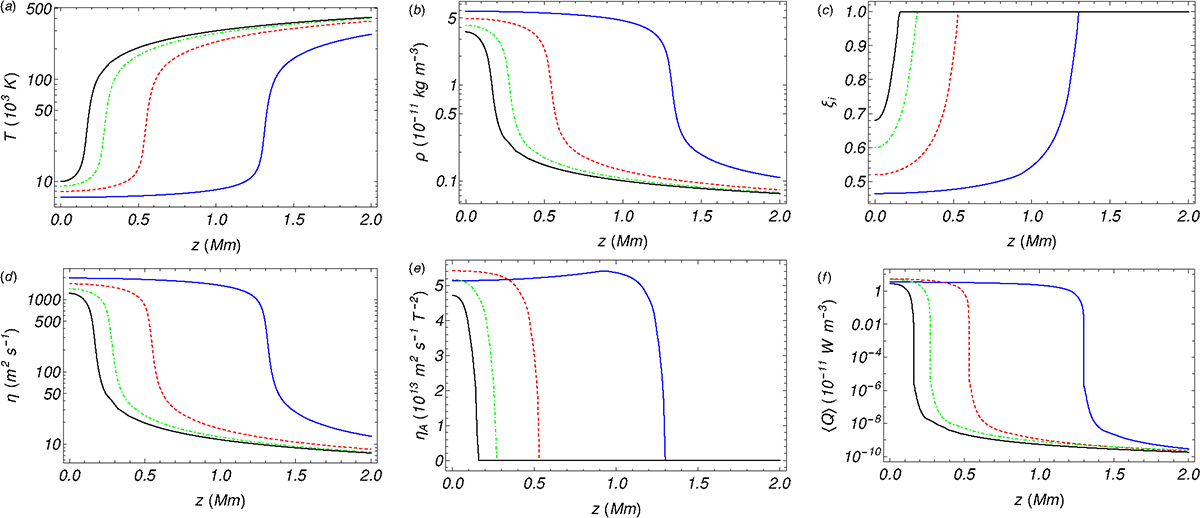
Fig. 6.
Download original image
Same as Fig. 5 but for different values of the central temperature. Namely, the values are T0 = 7000 K (solid blue line), T0 = 8000 K (dashed red line), T0 = 9000 K (dash-dotted green line), and T0 = 10 000 K (solid black line). Only a close-up view of the central part and the PCTR of the thread for z ≥ 0 are displayed. These results are for ⟨π⟩= 0.2 W m−2.
Current usage metrics show cumulative count of Article Views (full-text article views including HTML views, PDF and ePub downloads, according to the available data) and Abstracts Views on Vision4Press platform.
Data correspond to usage on the plateform after 2015. The current usage metrics is available 48-96 hours after online publication and is updated daily on week days.
Initial download of the metrics may take a while.