Open Access
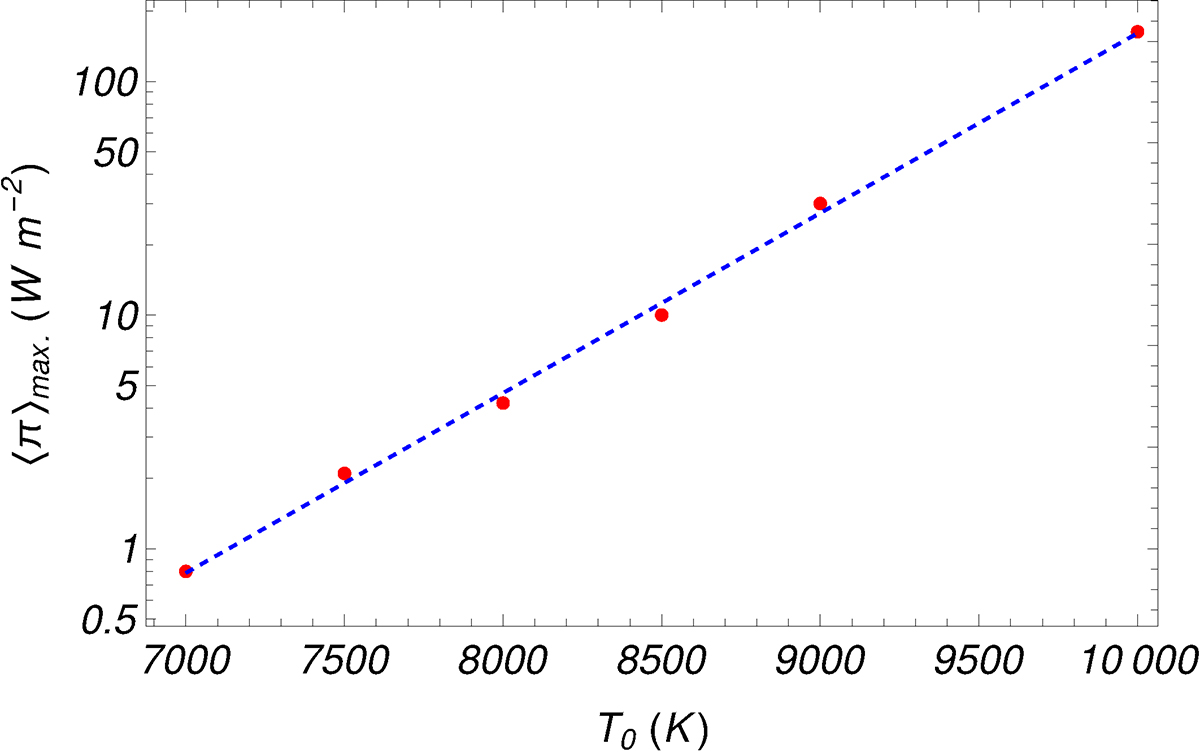
Fig. 11.
Download original image
Maximum wave energy flux injected at the photosphere, ⟨π⟩max. as a function of the thread central temperature, T0. The symbols are the results of the computations, while the dashed line is the fit of Eq. (32). We note that the vertical axis is in logarithmic scale.
Current usage metrics show cumulative count of Article Views (full-text article views including HTML views, PDF and ePub downloads, according to the available data) and Abstracts Views on Vision4Press platform.
Data correspond to usage on the plateform after 2015. The current usage metrics is available 48-96 hours after online publication and is updated daily on week days.
Initial download of the metrics may take a while.