Open Access
Fig. 3
Download original image
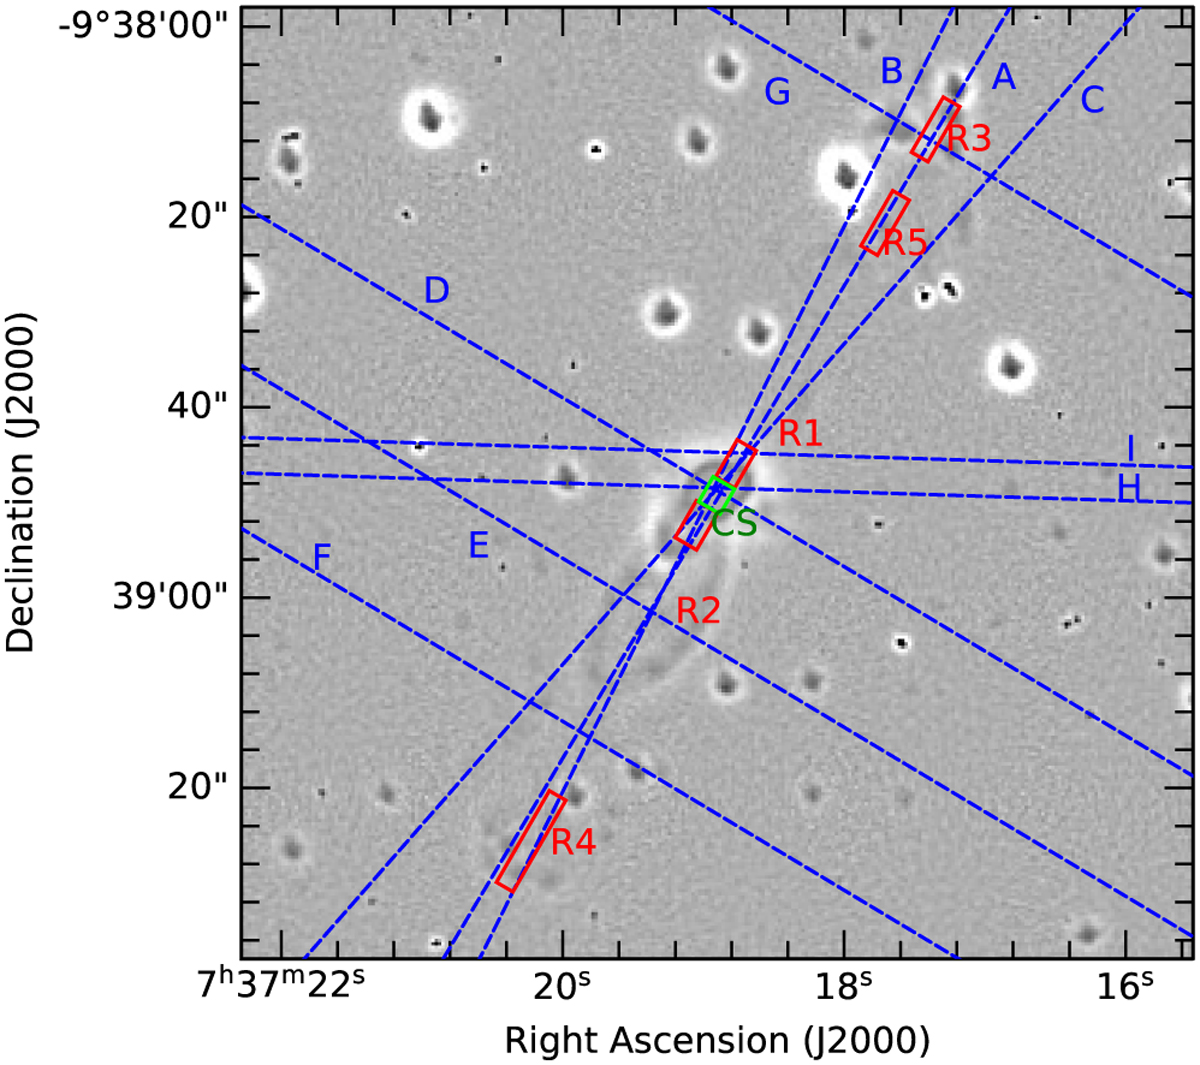
M 1–16 as seen in Ηα+[Ν II] unsharp-masked images taken with MES in image mode. The MES and the B&Ch slits are overlaid in blue dashed lines and red boxes, respectively. The CS region is shown as a green box.
Current usage metrics show cumulative count of Article Views (full-text article views including HTML views, PDF and ePub downloads, according to the available data) and Abstracts Views on Vision4Press platform.
Data correspond to usage on the plateform after 2015. The current usage metrics is available 48-96 hours after online publication and is updated daily on week days.
Initial download of the metrics may take a while.