Fig. 1
Download original image
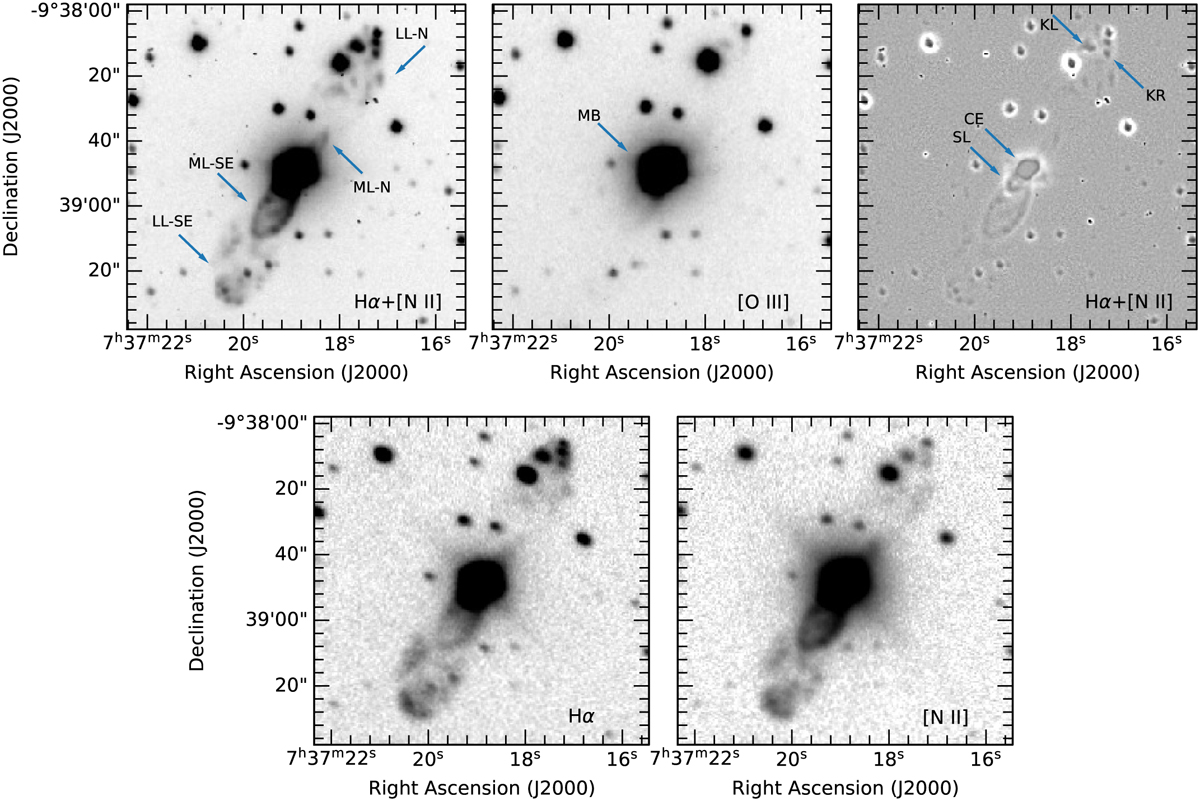
Narrow band optical images of M 1–16 a seen in different emission lines. Top panel: M 1–16 as seen in Ηα+[Ν II] (left), [O III] (middle), and unsharp masked Ηα+[Ν II] (right) images obtained with MES in image mode. Bottom panel: Separated Hα (left) and [Ν II] (right) images obtained with the MEXMAN camera. Arbitrary contrast scales were set to all images to enhance the different features seen in the nebula. North is up and east is to the left in all of the images.
Current usage metrics show cumulative count of Article Views (full-text article views including HTML views, PDF and ePub downloads, according to the available data) and Abstracts Views on Vision4Press platform.
Data correspond to usage on the plateform after 2015. The current usage metrics is available 48-96 hours after online publication and is updated daily on week days.
Initial download of the metrics may take a while.