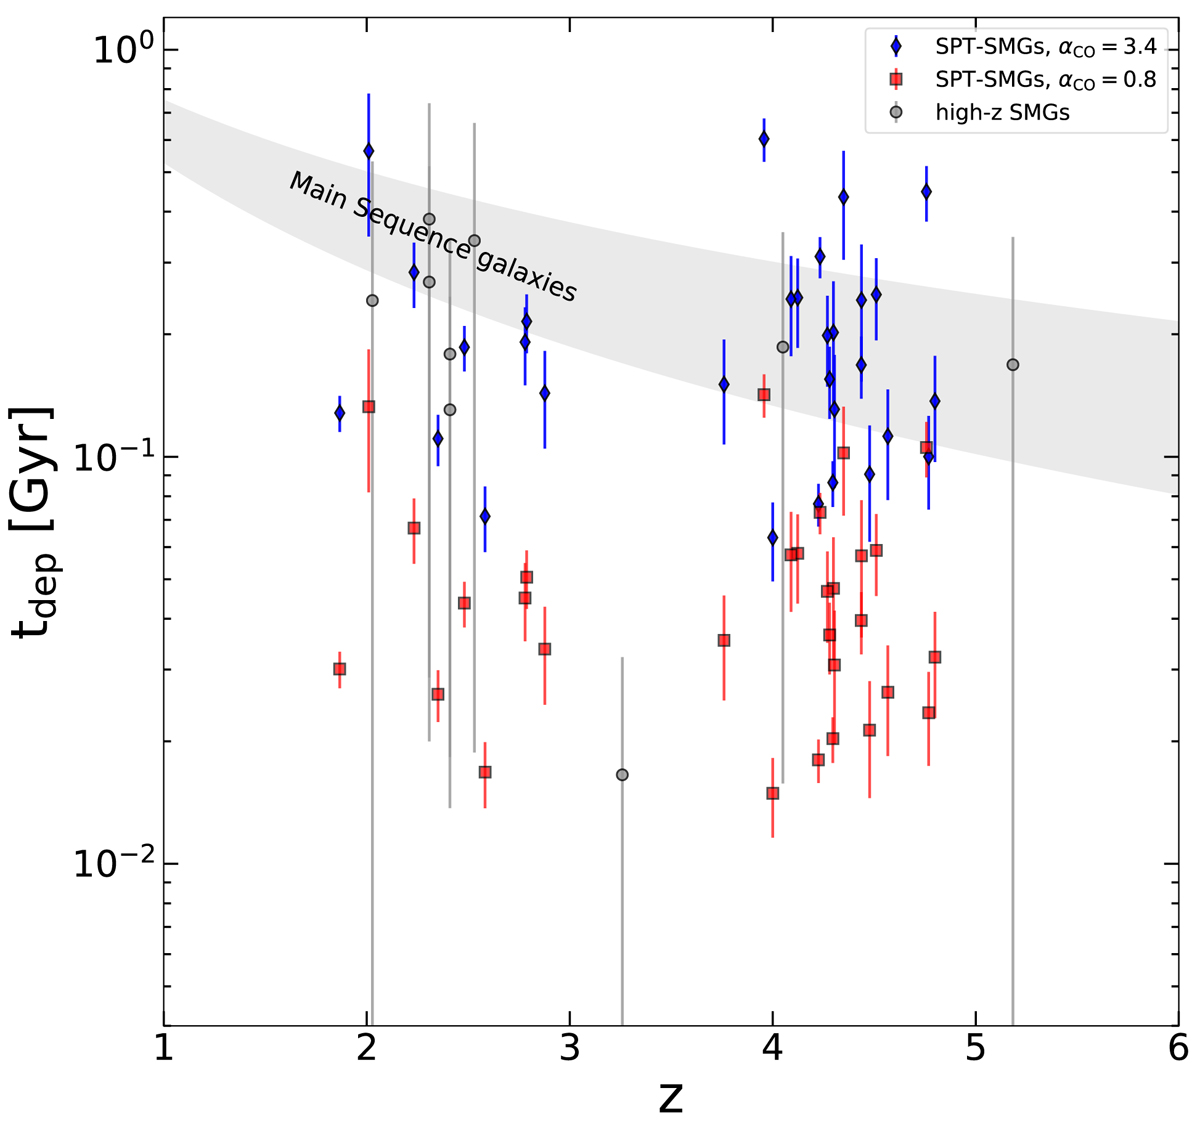
Fig. 7.
Download original image
Depletion timescale as a function of redshift for our sample. We compare the depletion timescale of our sample (blue diamonds and red squares) along with the SMGs (grey circles) from Carilli et al. (2010), Walter et al. (2012), Ivison et al. (2013), Fu et al. (2012, 2013), Alaghband-Zadeh et al. (2013). The blue diamonds represent the depletion timescales corresponding to gas mass calculated using αCO = 3.4 and the red squares are computed using αCO = 0.8. The main sequence in the grey shaded region follows the relation presented in Saintonge et al. (2013), with α values ranging from −1.5 (Davé et al. 2012) to −1.0 (Magnelli et al. 2013).
Current usage metrics show cumulative count of Article Views (full-text article views including HTML views, PDF and ePub downloads, according to the available data) and Abstracts Views on Vision4Press platform.
Data correspond to usage on the plateform after 2015. The current usage metrics is available 48-96 hours after online publication and is updated daily on week days.
Initial download of the metrics may take a while.