Fig. D.1.
Download original image
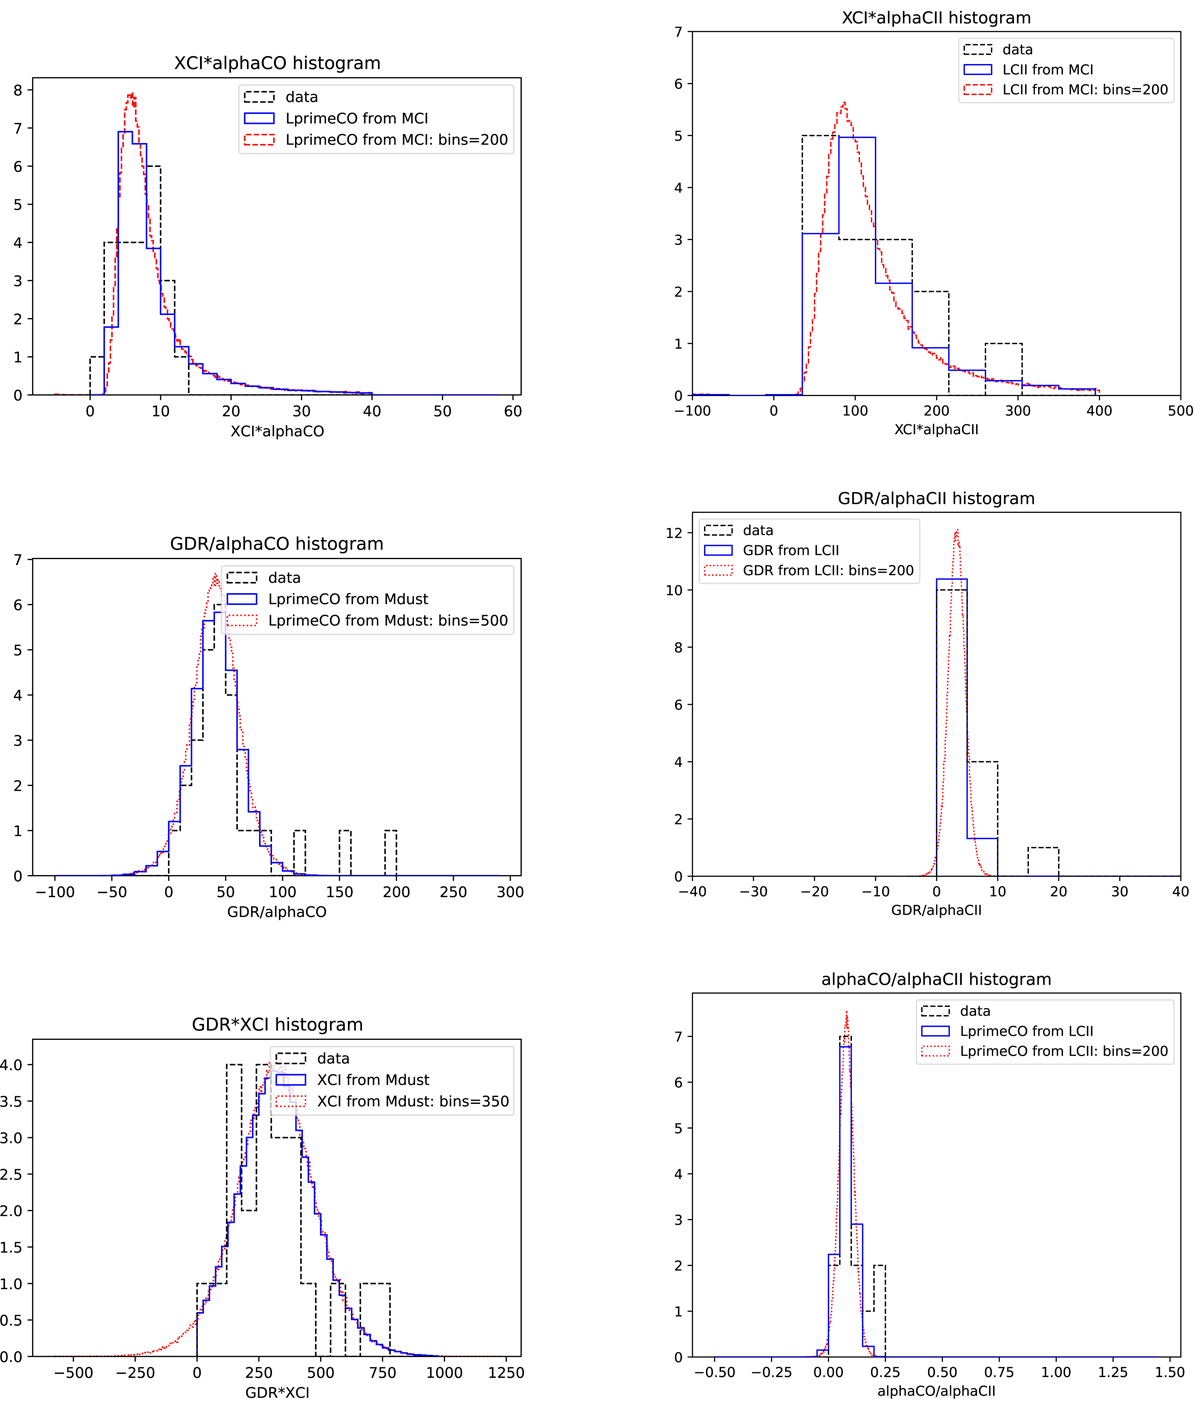
Cross-calibration with the tracers, XCI × αCO (left) and XCI × α[CII] (right), δGDR/αCO (left) and δGDR/α[CII] (right), and XCI × αCO (left) and αCO/α[CII] (right), are compared against the simulation described in Sect. D in the first, second, and third row, respectively. The resulting data, including the measurement uncertainty is represented as the blue solid line (binned the same as the original data), and the red dotted line.
Current usage metrics show cumulative count of Article Views (full-text article views including HTML views, PDF and ePub downloads, according to the available data) and Abstracts Views on Vision4Press platform.
Data correspond to usage on the plateform after 2015. The current usage metrics is available 48-96 hours after online publication and is updated daily on week days.
Initial download of the metrics may take a while.