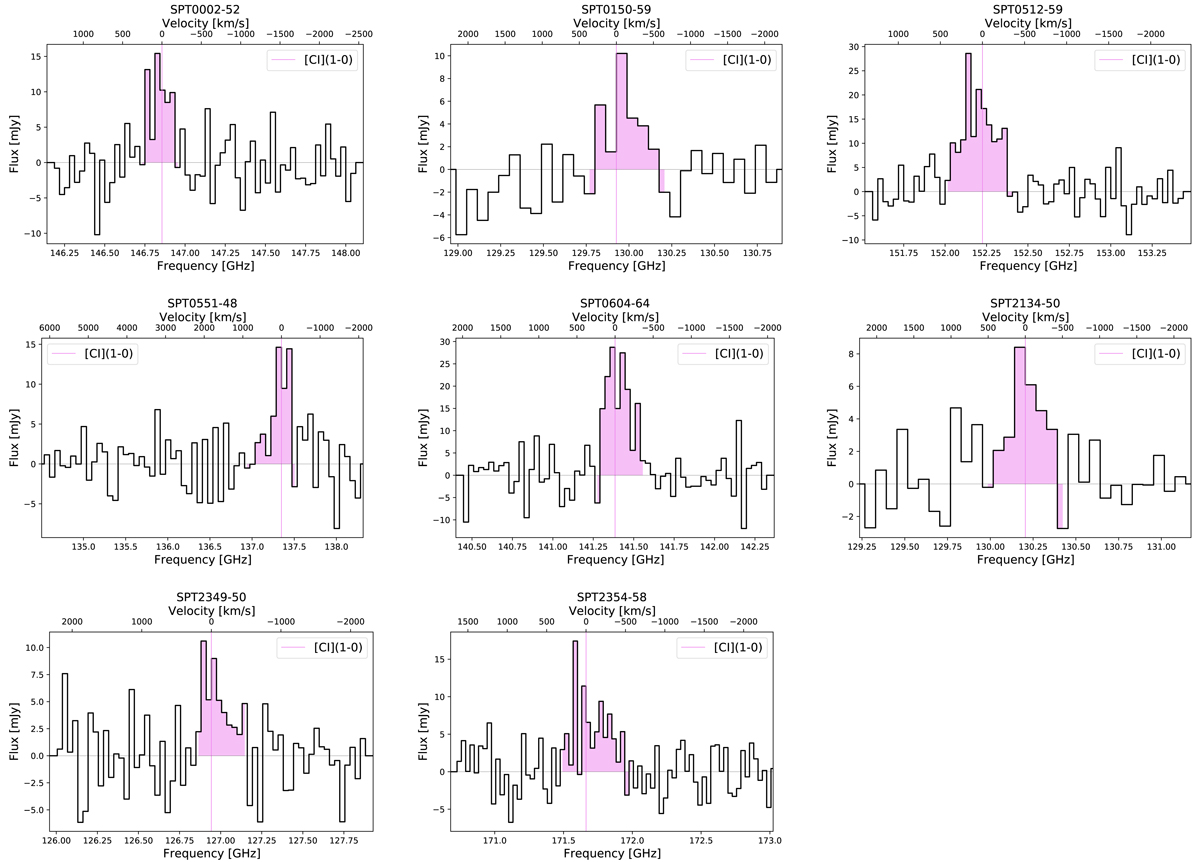
Fig. 1.
Download original image
[CI](1–0) spectra of our sample. The violet dotted line represents the [CI](1–0) line frequency based on the redshifts from Reuter et al. (2020) and the velocity axis is centred at this [CI](1–0) frequency. The violet shaded region represents the integrated limits to compute the integrated intensities of the [CI](1–0) line of our sources.
Current usage metrics show cumulative count of Article Views (full-text article views including HTML views, PDF and ePub downloads, according to the available data) and Abstracts Views on Vision4Press platform.
Data correspond to usage on the plateform after 2015. The current usage metrics is available 48-96 hours after online publication and is updated daily on week days.
Initial download of the metrics may take a while.