Fig. 5.
Download original image
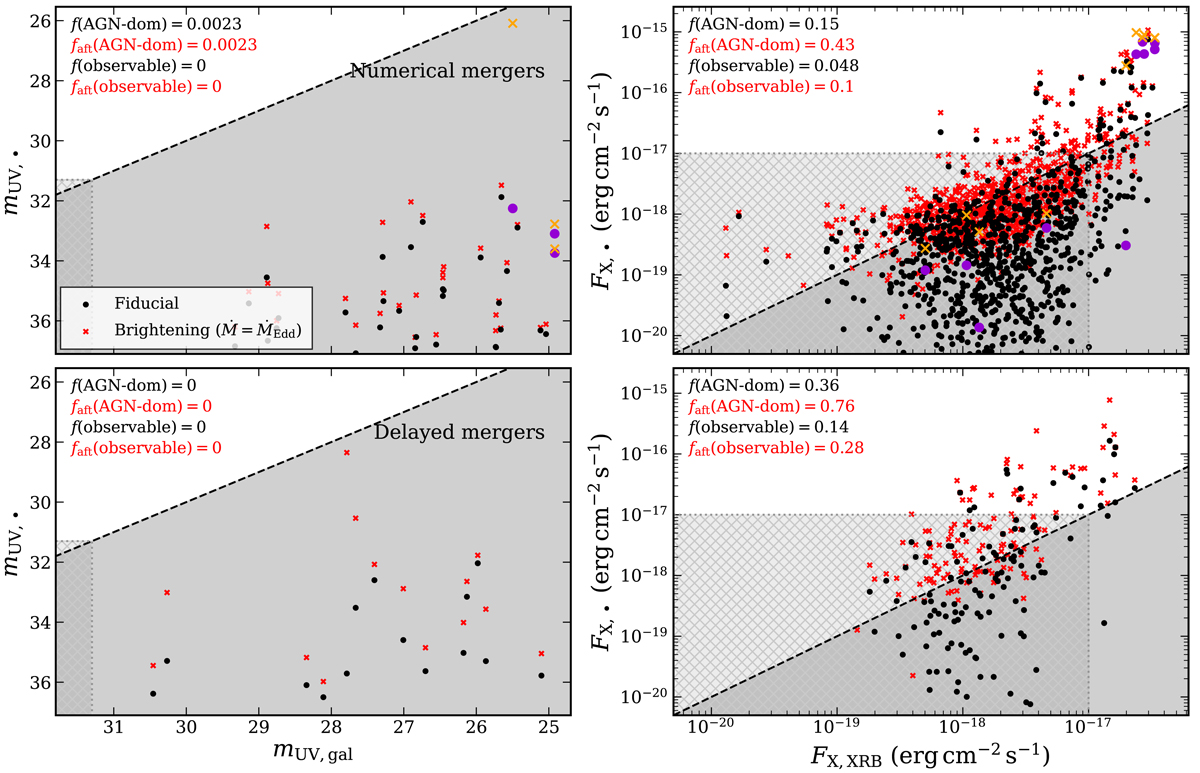
Black-hole vs galaxy flux, both corrected for absorption. Left column: rest-frame UV magnitude at ν = 1500 Å; right column: X-ray 0.5 − 10 keV band. Top row: numerical mergers; bottom row: delayed mergers. Black dots: accretion rate measured in the simulation; red crosses: merger-induced brightening with fEdd = 1. The grey region corresponds to galaxies dominating the emission over their BHs. The black dashed line indicates the boundary where the luminosity and galaxy and BH are equal. The hatched region corresponds to galaxies and BHs below the minimum flux needed for detection, which we set to mUV, lim = 31.3 (UV) and FX, lim = 10−17 erg cm−2 s−1 (X-rays). In the top left corner, we indicate the fraction of BHs with higher flux than their host galaxies and that of BHs above the observational flux limit. We note that a significant fraction of sources are very faint and lie beyond the limits of the plot, especially in the UV. Mergers that are GW undetected by LISA are shown with bigger and lighter markers, in purple and orange, for the fiducial and brightening cases. In UV all merging BHs are outshone by their host galaxy, while in X-rays a fraction of merging BHs are both brighter than the host galaxy and detectable by sensitive X-ray telescopes.
Current usage metrics show cumulative count of Article Views (full-text article views including HTML views, PDF and ePub downloads, according to the available data) and Abstracts Views on Vision4Press platform.
Data correspond to usage on the plateform after 2015. The current usage metrics is available 48-96 hours after online publication and is updated daily on week days.
Initial download of the metrics may take a while.