Fig. 4.
Download original image
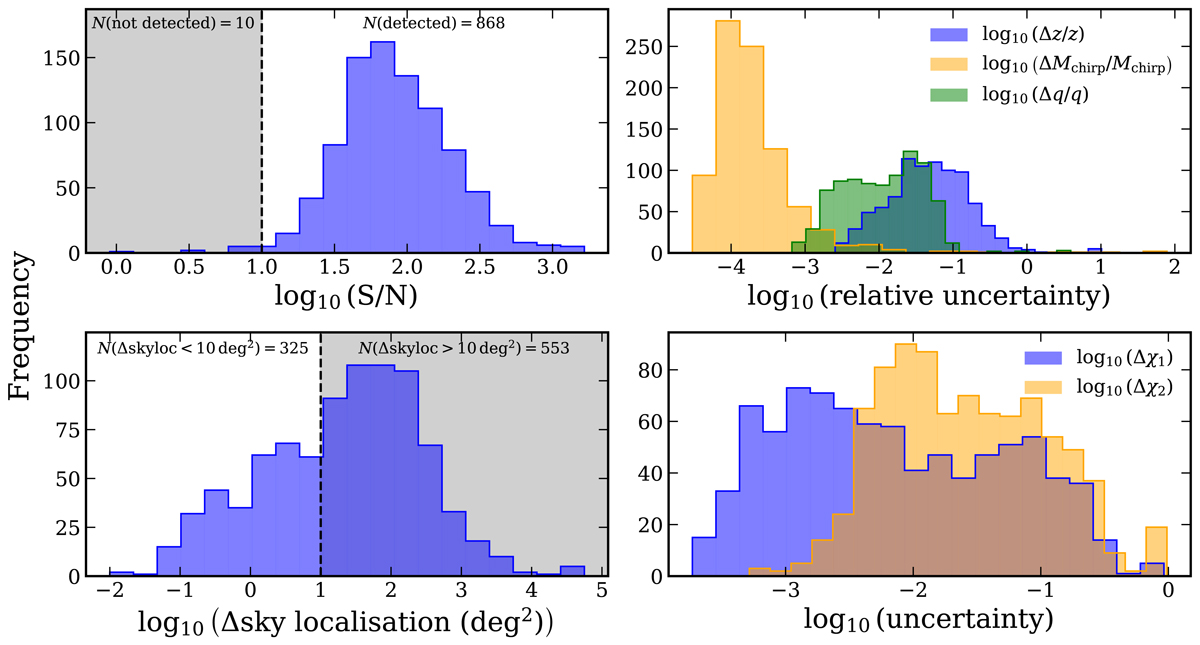
Parameter distribution for the mock LISA data analysis. The top-left panel shows the signal-to-noise ratio (S/N) distributions. Gravitational wave events are assumed to be detected if S/N > 10, indicated by the vertical dashed line. The 90%-confidence error in the sky localisation is shown in the bottom-left panel. The dashed line delimits the shaded region, which corresponds to the events with sky localisation poorer than 10 deg2. The relative 90%-confidence error distributions for z, Mchirp and q, and for χ1 and χ2, are shown in the right panels, top and bottom respectively. Most parameters are recovered with small uncertainties. The majority of mergers have sky localisation worse than 10 deg2 at the time of the merger.
Current usage metrics show cumulative count of Article Views (full-text article views including HTML views, PDF and ePub downloads, according to the available data) and Abstracts Views on Vision4Press platform.
Data correspond to usage on the plateform after 2015. The current usage metrics is available 48-96 hours after online publication and is updated daily on week days.
Initial download of the metrics may take a while.