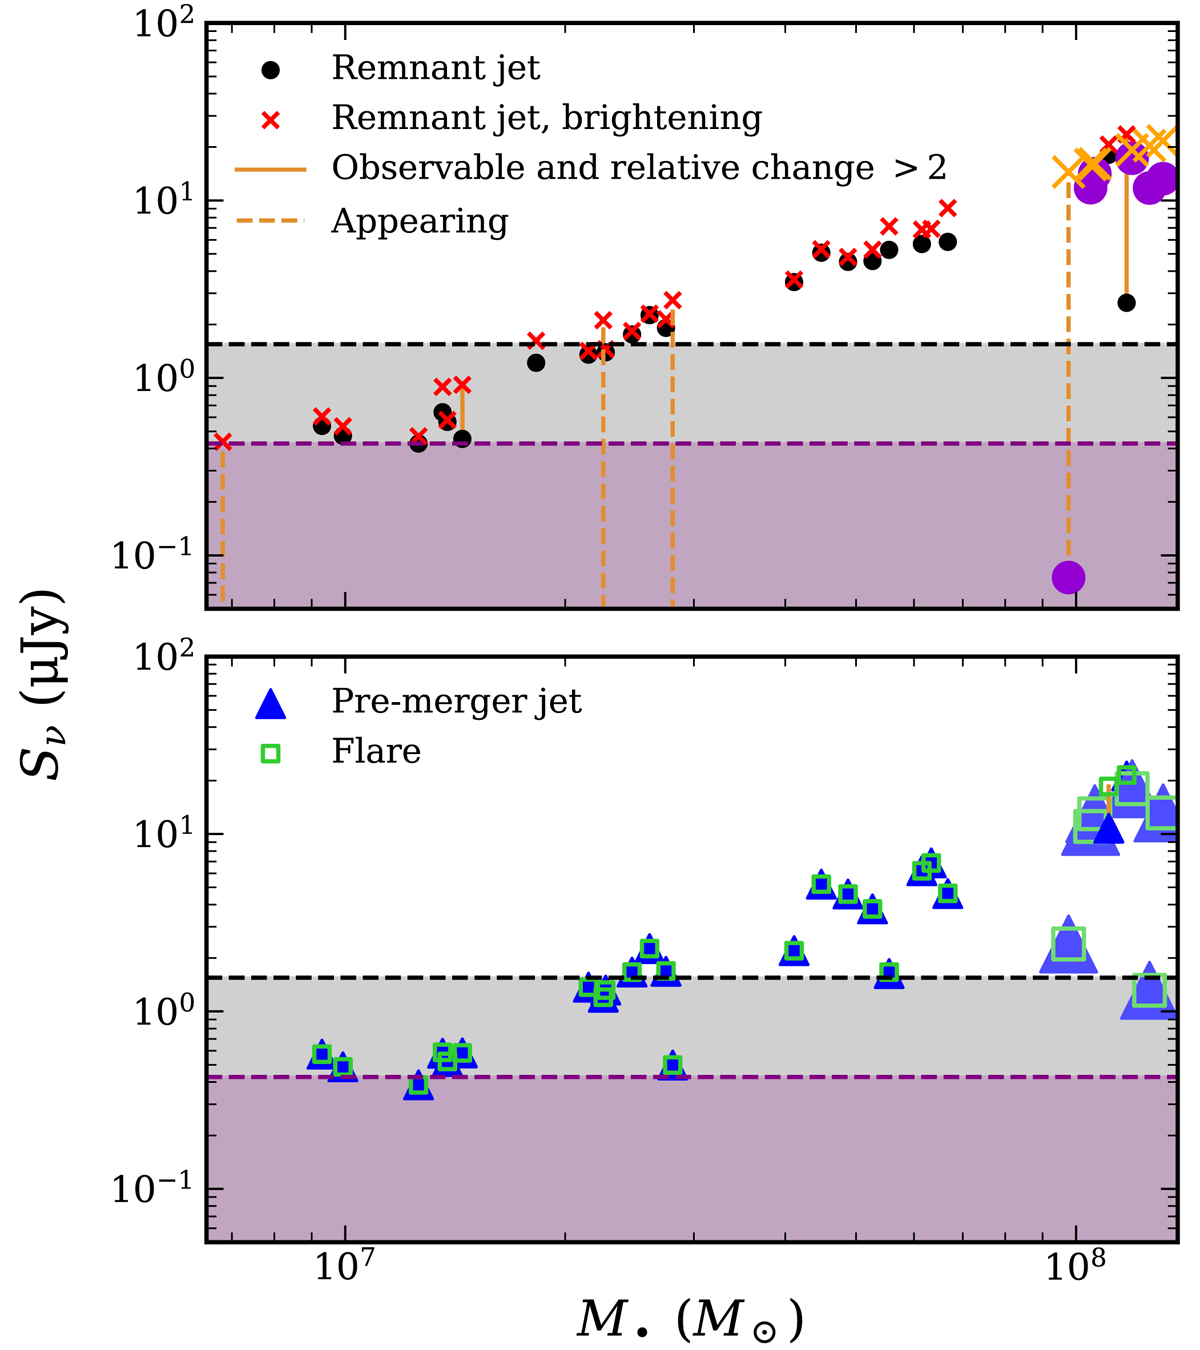
Fig. 12.
Download original image
Observability of a transient generated by a fEdd = 1 brightening (top panel) or a merger-induced flare (bottom panel) in the numerical merger sample. Black dots and red crosses correspond to the post-merger BH radio fluxes for the fiducial and the rebrightening scenario, respectively. The pre-merger primary BH radio flux is shown in blue triangles, and the flare flux is shown in green squares. We only show mergers for which either the fiducial or the merger-enhanced (brightening or flare) flux is observable. Fiducial and merger-enhanced fluxes are connected by orange dashed lines if the fiducial flux is undetected and the enhanced flux is detected, or orange solid lines if the flux is detected in both cases and the flux change is larger than a factor of 2. For simplicity, we only consider the detectability of the pessimistic model by the SKA (assuming a sensitivity of 0.4 μJy, purple horizontal line), but the ngVLA sensitivity is also shown for reference (1.5 μJy, black horizontal line). GW-undetected events are shown with bigger, brighter markers. With our modelling, most of the merger-induced flux changes are too small to be detectable in radio.
Current usage metrics show cumulative count of Article Views (full-text article views including HTML views, PDF and ePub downloads, according to the available data) and Abstracts Views on Vision4Press platform.
Data correspond to usage on the plateform after 2015. The current usage metrics is available 48-96 hours after online publication and is updated daily on week days.
Initial download of the metrics may take a while.