Fig. 11.
Download original image
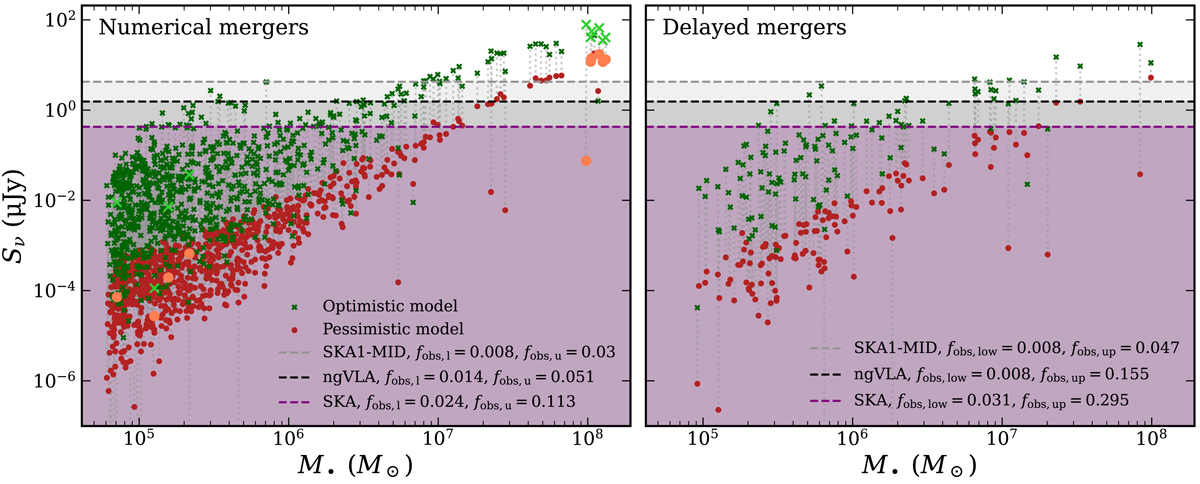
Observer-frame spectral flux density at ν = 2 GHz of numerical merger remnants against the remnant BH mass, for numerical mergers (left panel) and delayed mergers (right panel). For each sample, the ‘lower limit’ model (based on the fundamental plane, Gültekin et al. 2009) is shown with dark red circles, and the ‘upper limit’ model (based on the theoretical model in Meier 2001) is shown with dark green crosses. The dashed horizontal lines represent the 5σ sensitivity thresholds for the ngVLA (Carilli et al. 2015), in black, for the SKA1-MID, in grey, and for the SKA (Prandoni & Seymour 2015), in purple. These thresholds are calculated assuming 9 h exposure times and that the observed sources are not resolved. The legend indicates the fraction of observable events, which lie above the sensitivity threshold of each instrument and are observable with LISA, if applicable. Mergers that are undetected with LISA are shown with bigger and lighter markers.
Current usage metrics show cumulative count of Article Views (full-text article views including HTML views, PDF and ePub downloads, according to the available data) and Abstracts Views on Vision4Press platform.
Data correspond to usage on the plateform after 2015. The current usage metrics is available 48-96 hours after online publication and is updated daily on week days.
Initial download of the metrics may take a while.