Fig. 10.
Download original image
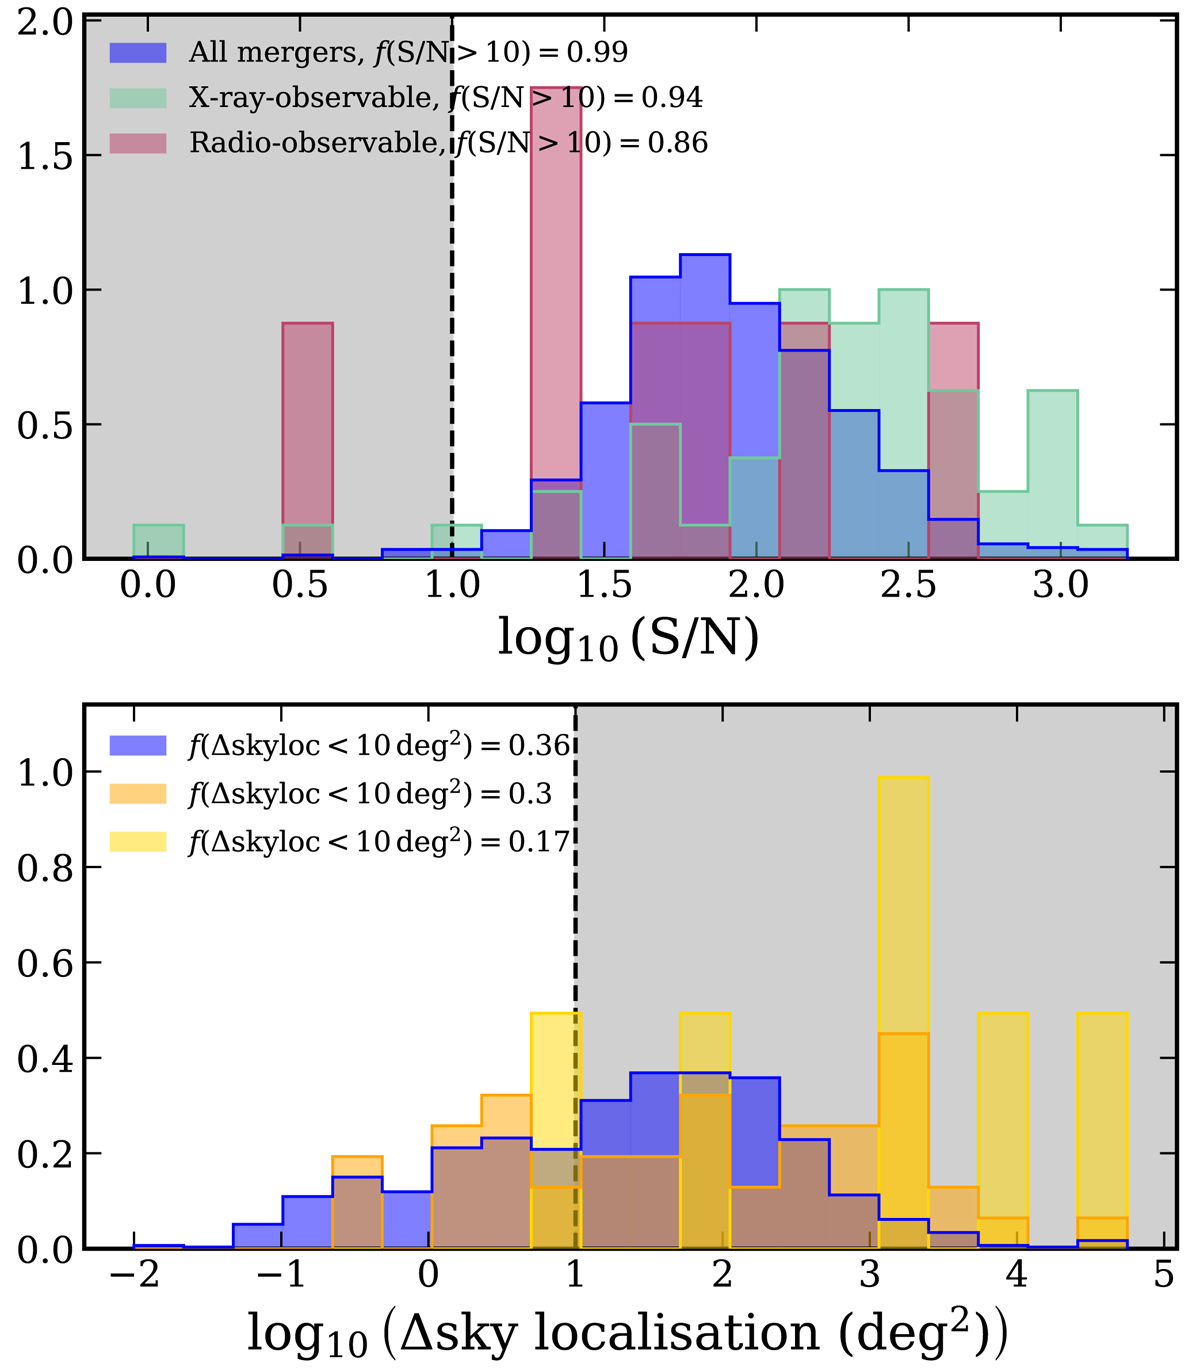
LISA 90%-confidence GW sky localisation error of EM-observable mergers. The top panel shows the distribution of all numerical mergers (in blue), X-ray-observable mergers (in green), and radio-observable mergers with SKA in the pessimistic model (in pink). The bottom panel shows the distribution of X-ray EM counterparts (in orange) and radio EM counterparts (in yellow).
Current usage metrics show cumulative count of Article Views (full-text article views including HTML views, PDF and ePub downloads, according to the available data) and Abstracts Views on Vision4Press platform.
Data correspond to usage on the plateform after 2015. The current usage metrics is available 48-96 hours after online publication and is updated daily on week days.
Initial download of the metrics may take a while.