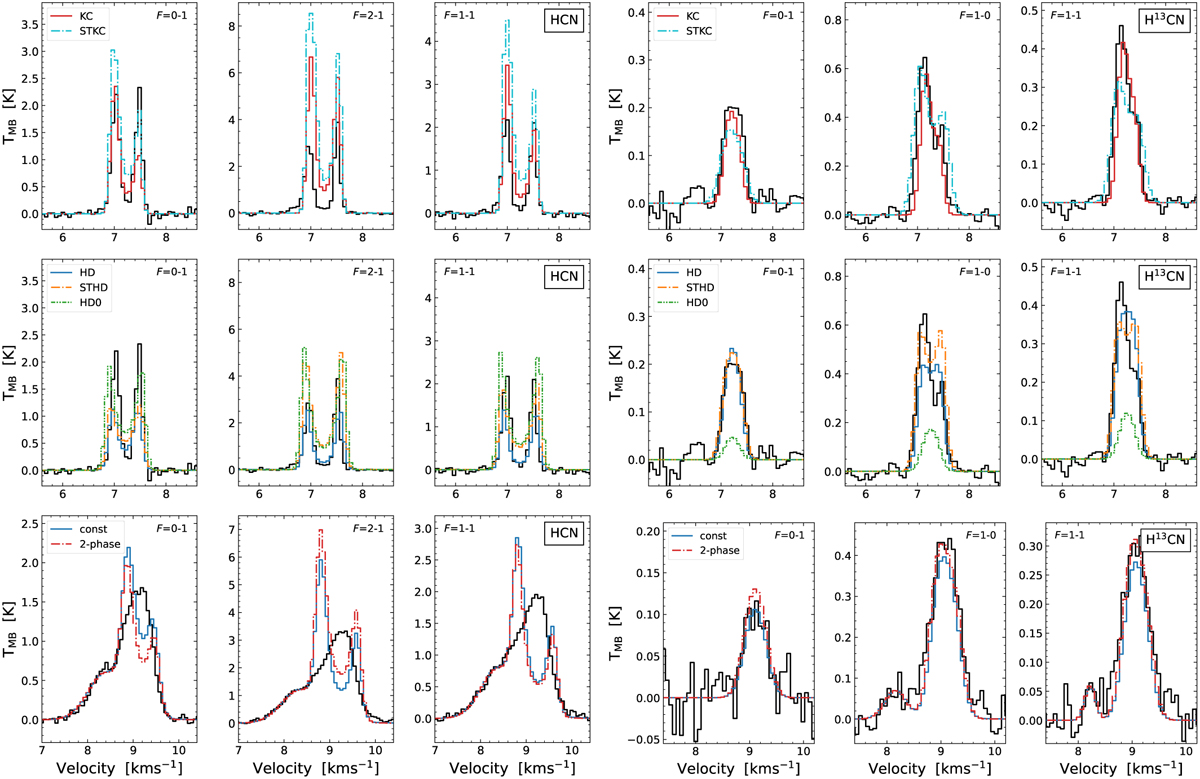
Fig. 6
Download original image
Synthetic spectra of HCN (left) and H13CN (right) obtained with LOC (top rows: L1544, bottom row: HH211). For L1544, the results are splitted between using the Keto-Caselli model (top) and the HDCRT model (centre) as approximation for the physical structure of the core. Towards L1544, the best-fitting abundances and timesteps are 2 × 10⁻⁸ (KC), 7.9e5 yr (STKC), 1 × 10⁻⁸ (HD), 1.3e5 yr (STHD) for HCN; 2 × 10⁻¹⁰ (KC), 6e5 yr (STKC), 3 × 10⁻¹⁰ (HD), 1e5 yr (STHD) for H13CN. Towards HH211, the best-fitting abundances and timesteps are 2 × 10⁻⁹ (const), 1e5 yr (2-phase) for HCN; 3 × 10⁻¹¹ (const), 1.3e5 yr (2-phase) for H13CN.
Current usage metrics show cumulative count of Article Views (full-text article views including HTML views, PDF and ePub downloads, according to the available data) and Abstracts Views on Vision4Press platform.
Data correspond to usage on the plateform after 2015. The current usage metrics is available 48-96 hours after online publication and is updated daily on week days.
Initial download of the metrics may take a while.