Fig. D.2
Download original image
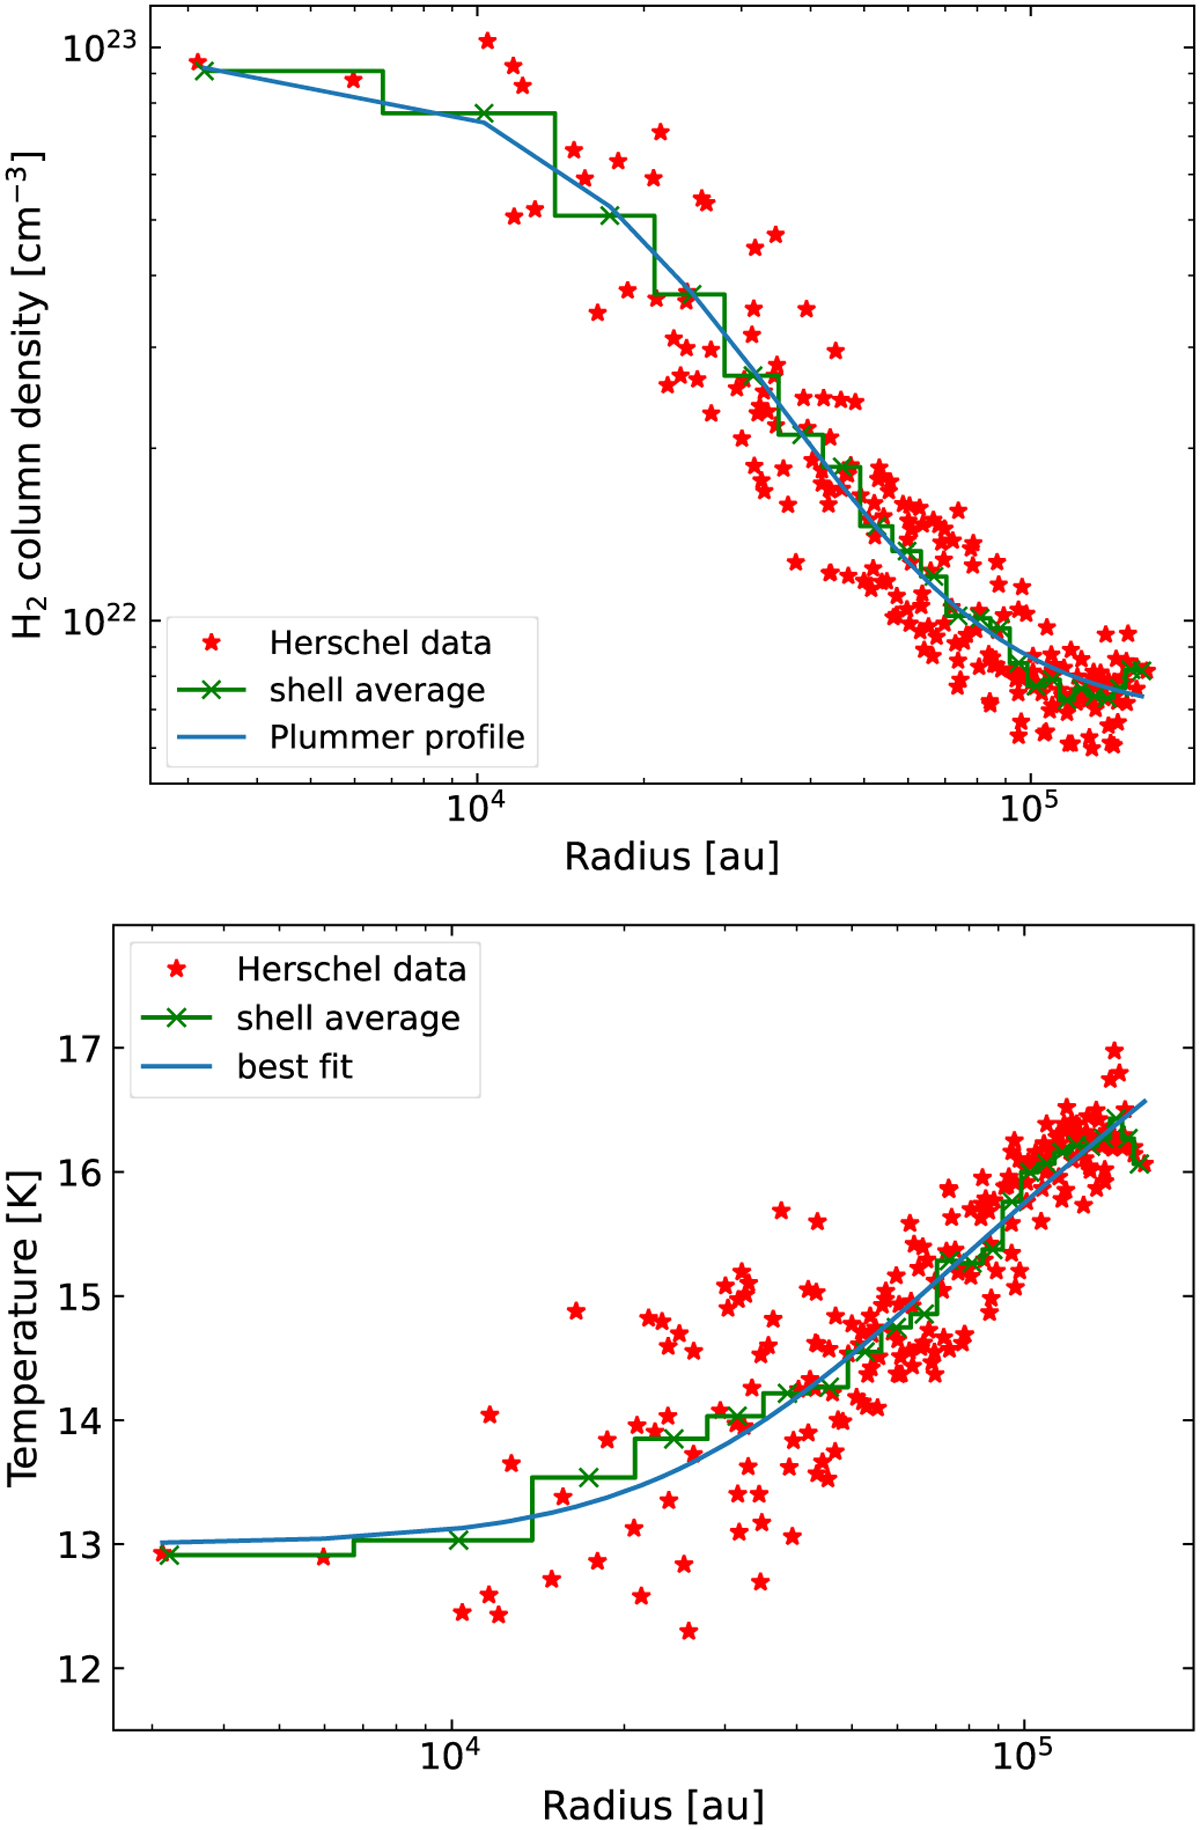
Analysis of the H2 column density map and the temperature map derived from Herschel data. Top: Radial H2 column density profile (red), overlaid with the fitted Plummer-like profile (blue). Given in green are the data points averaged over shells of 11 arcsec, the size corresponding to 1/3 of the Herschel beam size. Bottom: Radial temperature profile (red), overlaid with the best fit (blue) and the averaged shells (green).
Current usage metrics show cumulative count of Article Views (full-text article views including HTML views, PDF and ePub downloads, according to the available data) and Abstracts Views on Vision4Press platform.
Data correspond to usage on the plateform after 2015. The current usage metrics is available 48-96 hours after online publication and is updated daily on week days.
Initial download of the metrics may take a while.