Fig. D.1
Download original image
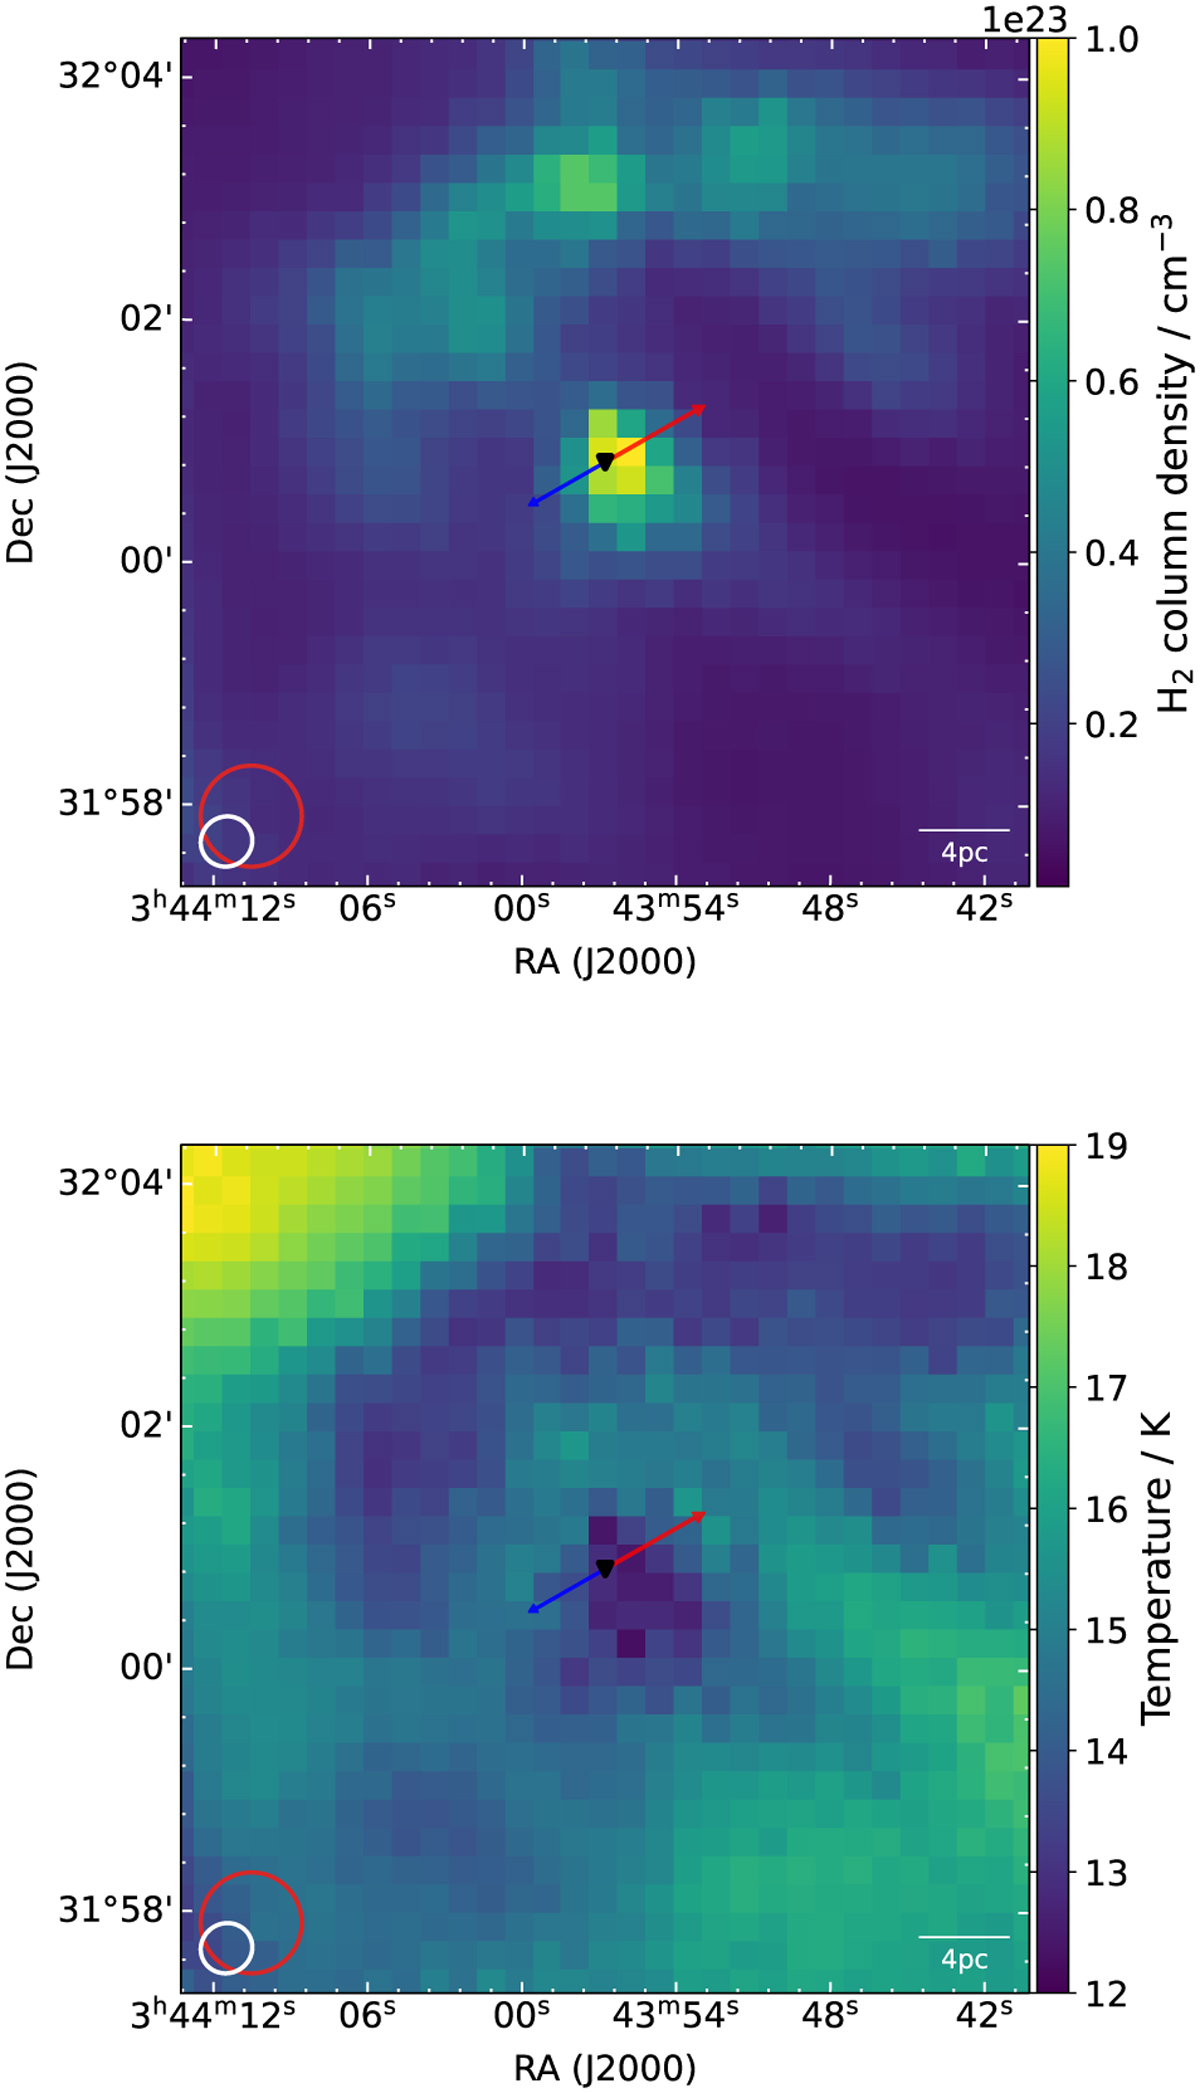
Analysis of Herschel SPIRE data towards HH211. Top: H2 column density map of HH211, derived using the Herschel SPIRE images at 250, 350 and 500 µm. The red and blue arrows indicate the direction and size of the molecular outflow/jet from the protostellar core (marked by a black triangle). The Herschel beam size is shown as a white circle, the average beam size of our observations is shown as red circle. Bottom: Dust temperature map of HH211, derived using the Herschel SPIRE images at 250, 350 and 500 µm.
Current usage metrics show cumulative count of Article Views (full-text article views including HTML views, PDF and ePub downloads, according to the available data) and Abstracts Views on Vision4Press platform.
Data correspond to usage on the plateform after 2015. The current usage metrics is available 48-96 hours after online publication and is updated daily on week days.
Initial download of the metrics may take a while.