Open Access
Fig. A.2
Download original image
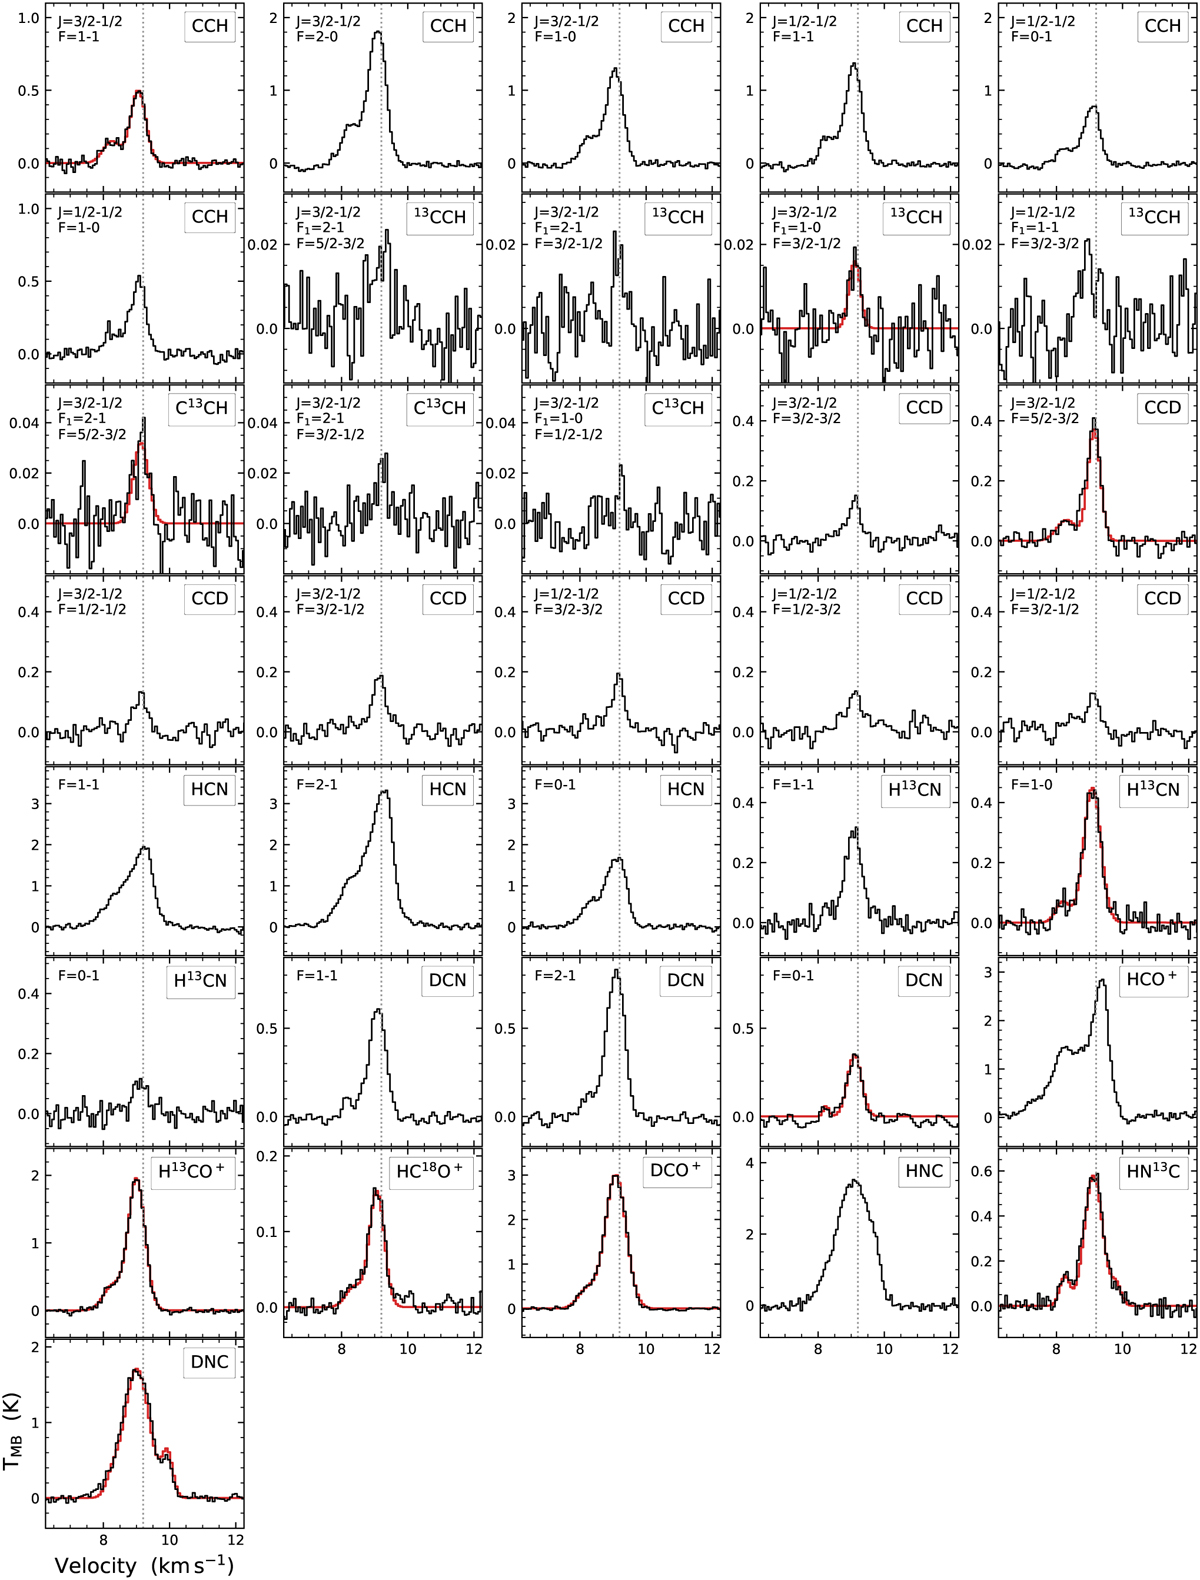
Ground-state rotational lines observed towards the protostellar core HH211. The respective hyperfine transition is given in the upper left corner of each plot. The dotted line indicates the rest velocity of the system (9.2 km s−1). The red curves show the fits used in the LTE analysis.
Current usage metrics show cumulative count of Article Views (full-text article views including HTML views, PDF and ePub downloads, according to the available data) and Abstracts Views on Vision4Press platform.
Data correspond to usage on the plateform after 2015. The current usage metrics is available 48-96 hours after online publication and is updated daily on week days.
Initial download of the metrics may take a while.