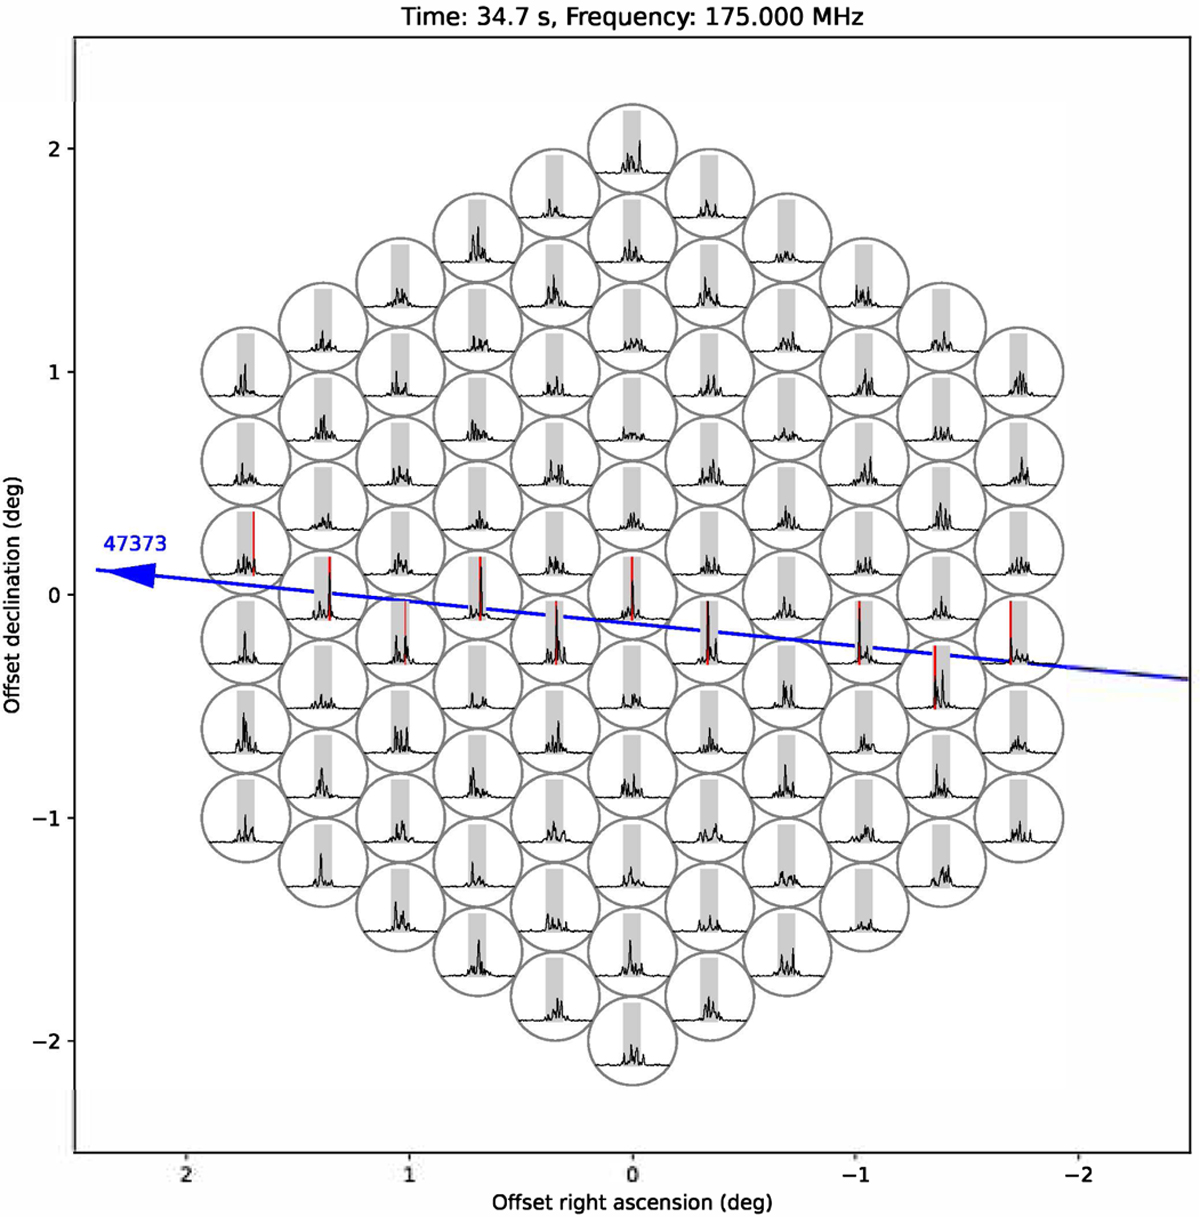
Fig. 8

Download original image
Visualisation of the detected signal from satellite 47373 as it crossed the field of view of the LOFAR tied array beam pattern. Each circle marks one of the beams. The inlays show the 175 MHz signal (spectral PFD) as a function of time spanning about ~20 s centred around the event time (approximately 35 s after observation start). The grey-shaded areas mark the total time interval over which the satellite was in the field of view, the red shaded areas refer to the time when the satellite was in the corresponding beam area.
Current usage metrics show cumulative count of Article Views (full-text article views including HTML views, PDF and ePub downloads, according to the available data) and Abstracts Views on Vision4Press platform.
Data correspond to usage on the plateform after 2015. The current usage metrics is available 48-96 hours after online publication and is updated daily on week days.
Initial download of the metrics may take a while.


