Fig. 7
Download original image
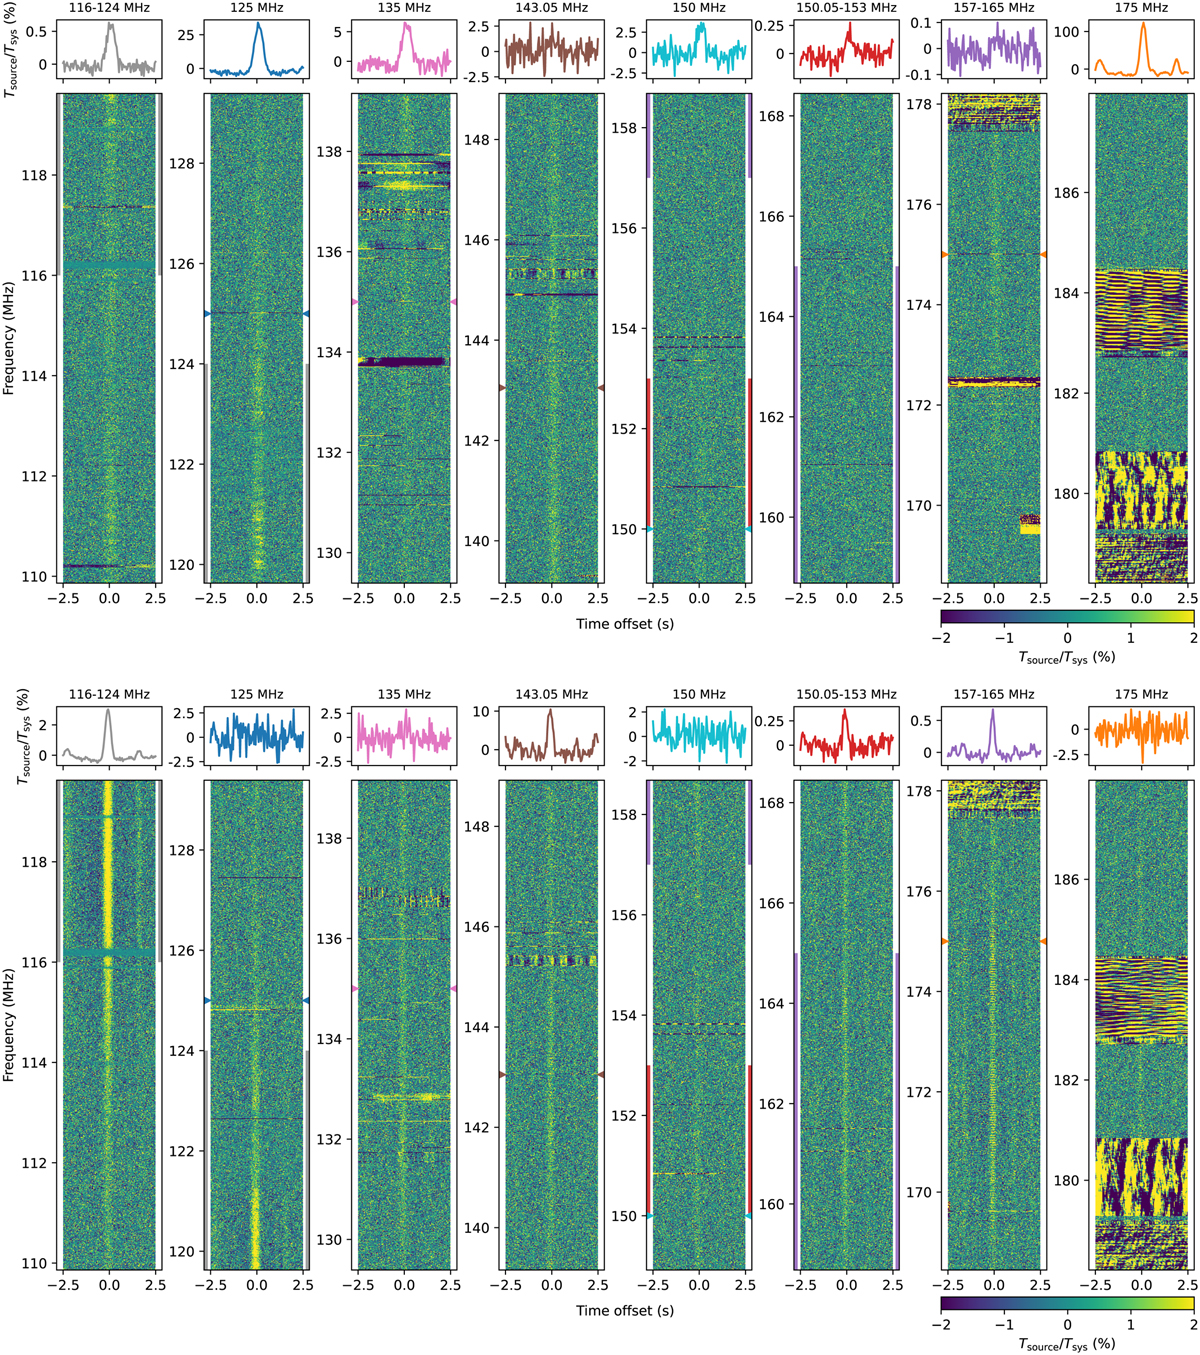
Spectral and temporal properties of the passes of satellites 45186 (average of 11 TABs) and 51998 (average of 10 TABs). For each satellite pass, normalised, aligned and averaged dynamic spectra are shown over the entire observed bandwidth and within 2.5 s on the predicted passage time. Time series at narrow-band frequencies of 125, 135, 143.05, 150, and 175 MHz are shown in the top insets, as well as for broad-band frequency ranges (116 to 124, 150.05 to 153, and 157-165 MHz). The colour of each time series matches the marked frequencies and frequency ranges in the same colours to the sides of the dynamic spectra. For both satellites a combination of broad-band and narrow-band emission is visible. In the case of satellite 45186, broad-band emission is mostly confined to the frequencies below 155 MHz, but narrow-band emission at 125, 135, 150, and 175 MHz is detected, with sidelobes being visible at 175 MHz. Some structure in the broad-band emission is obvious between 120 and 122 MHz. For satellite 51998, broad-band emission is clear at all frequencies not affected by terrestrial signals, while narrow-band emission is absent, except for 143.05 MHz. Between 170 and 176 MHz, a comb of narrow-band, regularly spaced peaks, is superposed on the broad-band emission. The temporal profiles show time offsets of the observed satellite pass with respect to predictions (+0.09 s for 45186, −0.07 s for 51998).
Current usage metrics show cumulative count of Article Views (full-text article views including HTML views, PDF and ePub downloads, according to the available data) and Abstracts Views on Vision4Press platform.
Data correspond to usage on the plateform after 2015. The current usage metrics is available 48-96 hours after online publication and is updated daily on week days.
Initial download of the metrics may take a while.