Fig. 6

Download original image
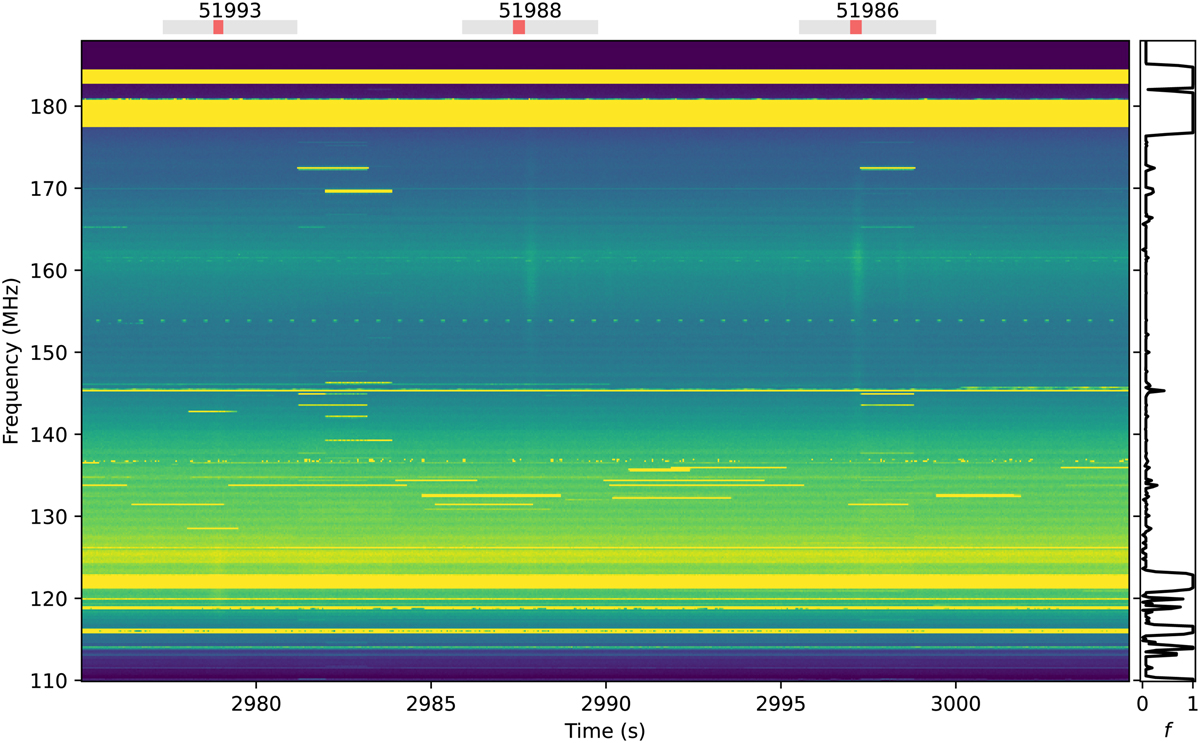
Dynamic spectrum of tied-array beam 18, showing broad-band radio emission of three Starlink satellites (NORAD IDs 51993, 51988 and 51986) coincident with the predictions from satellite ephemerides. For NORAD ID 51993, the emission is visible from 115 to 130 MHz, while objects 51988 and 51986 are more obvious from 140 to 175 MHz. The dynamic spectrum has been averaged by a factor four in time to a time resolution of 41 ms, and a factor 16 in frequency to a frequency resolution of 0.195 MHz. To show the temporal and spectral structure of the satellite emission, as well as that of other anthropogenic signals, the raw, uncalibrated dynamic spectrum is shown, without masking of anthropogenic signals. The bars at the top of the dynamic spectrum indicate the predicted time ranges where the indicated satellite passed through the LOFAR station beam (in grey), and the specific tied-array beam (in red). In the case of object 51988, the emission is about 0.33 s delayed compared to the prediction. The histogram on the right shows the fraction of the dynamic spectra that would have been masked in frequency by OAflagger (Offringa et al. 2012).
Current usage metrics show cumulative count of Article Views (full-text article views including HTML views, PDF and ePub downloads, according to the available data) and Abstracts Views on Vision4Press platform.
Data correspond to usage on the plateform after 2015. The current usage metrics is available 48-96 hours after online publication and is updated daily on week days.
Initial download of the metrics may take a while.


