Fig. 12
Download original image
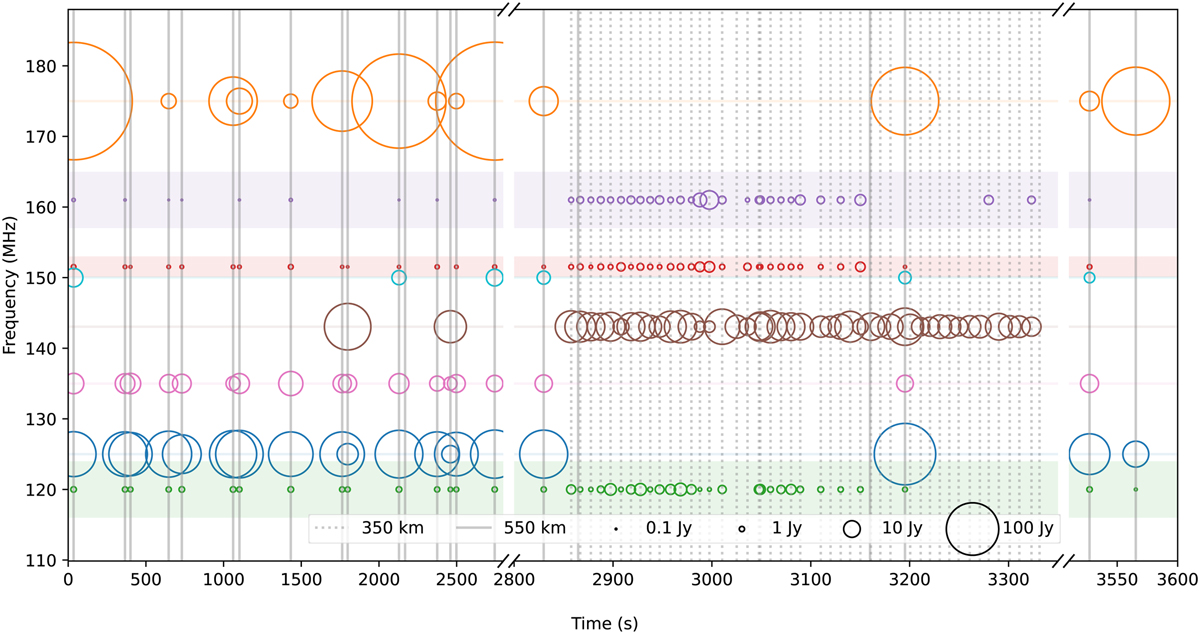
Radio emission detected from Starlink satellites during the LOFAR observation. Passes of Starlink satellites through the LOFAR beam pattern are marked in time with solid vertical lines for satellites at h = 550 km, and dotted lines for those at h = 350 km. The coloured horizontal lines and bands indicate the frequencies of frequency ranges in which fluxes were measured, with the circles indicating the corresponding flux density measurements.
Current usage metrics show cumulative count of Article Views (full-text article views including HTML views, PDF and ePub downloads, according to the available data) and Abstracts Views on Vision4Press platform.
Data correspond to usage on the plateform after 2015. The current usage metrics is available 48-96 hours after online publication and is updated daily on week days.
Initial download of the metrics may take a while.