Fig. 9
Download original image
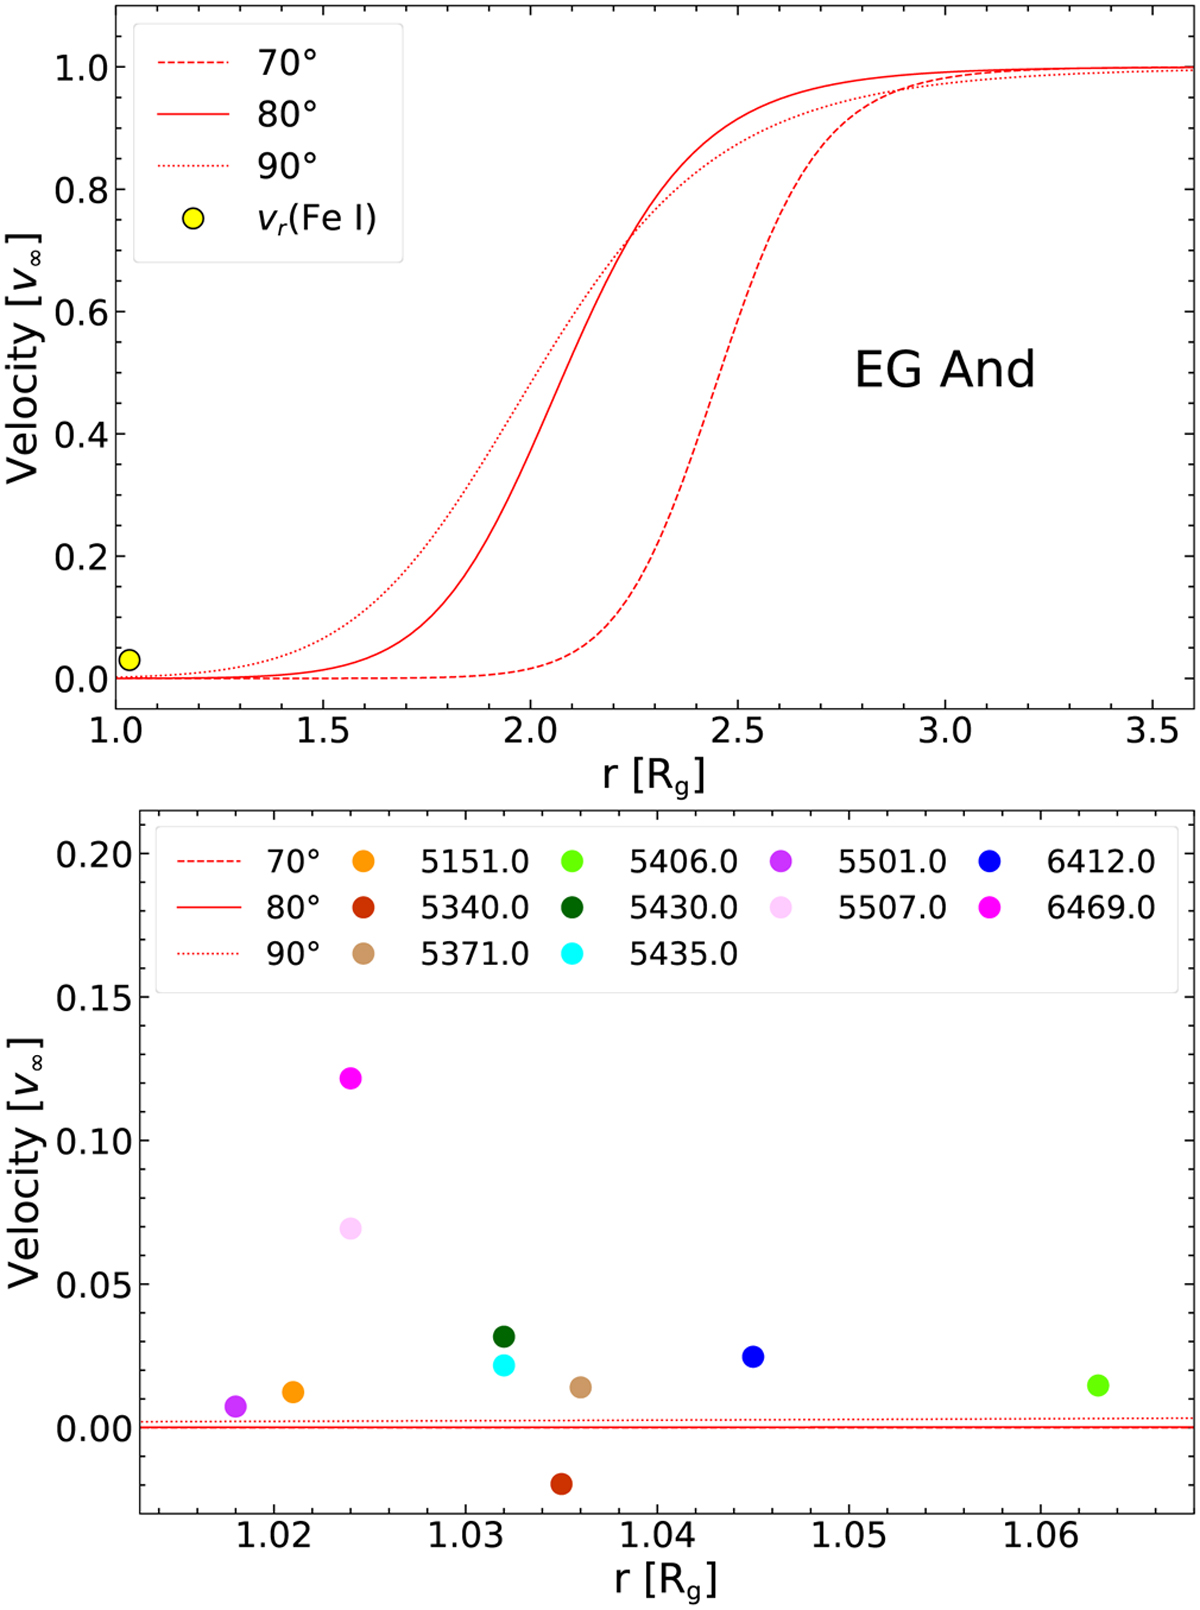
Comparison of the wind velocity profiles of RG in EG And (Shagatova et al. 2016) with the RV values of the Fe I absorption lines, υr(Fe I), that were paired with the distance r by the line-profile modelling (Sect. 3.3). In the top panel, the υr(Fe I) data point represents the average value over all modelled spectra (Sect. 3.4.2). The bottom panel is a zoomed view with vr(Fe I) values for the individual Fe I lines averaged over the orbital phases.
Current usage metrics show cumulative count of Article Views (full-text article views including HTML views, PDF and ePub downloads, according to the available data) and Abstracts Views on Vision4Press platform.
Data correspond to usage on the plateform after 2015. The current usage metrics is available 48-96 hours after online publication and is updated daily on week days.
Initial download of the metrics may take a while.